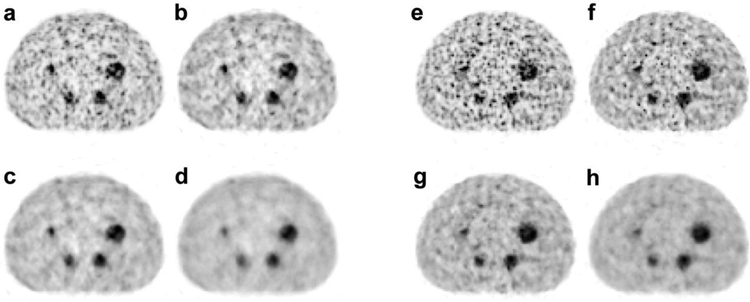
Figure 5.
NEMA-IQ phantom study with Y-90 a – reconstruction, b–d-: TOF-BSREM reconstructions with beta values of 1000, 2000 and 4000 respectively using the regular energy window (425–650 keV). e TOF-OSEM reconstruction, f - h: TOF-BSREM reconstructions with beta values of 1000, 2000 and 4000 respectively using the narrow energy window (460–562 keV).

