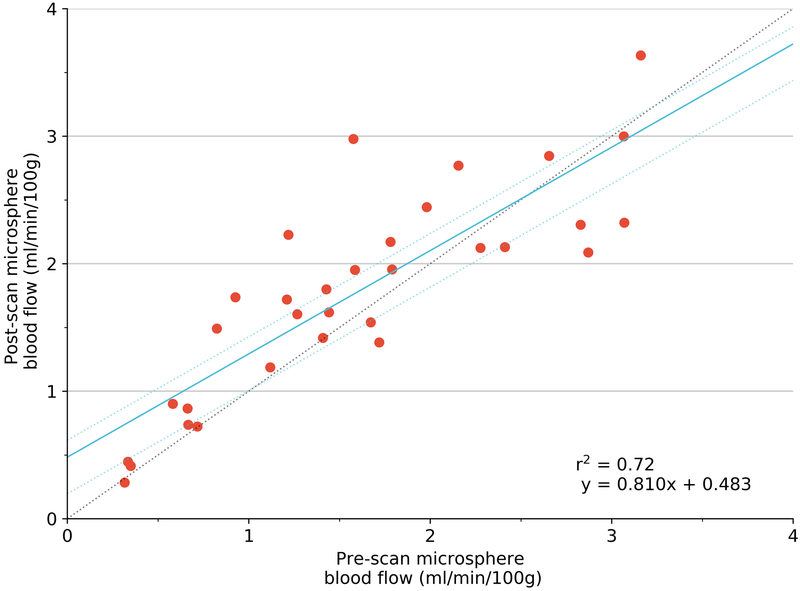
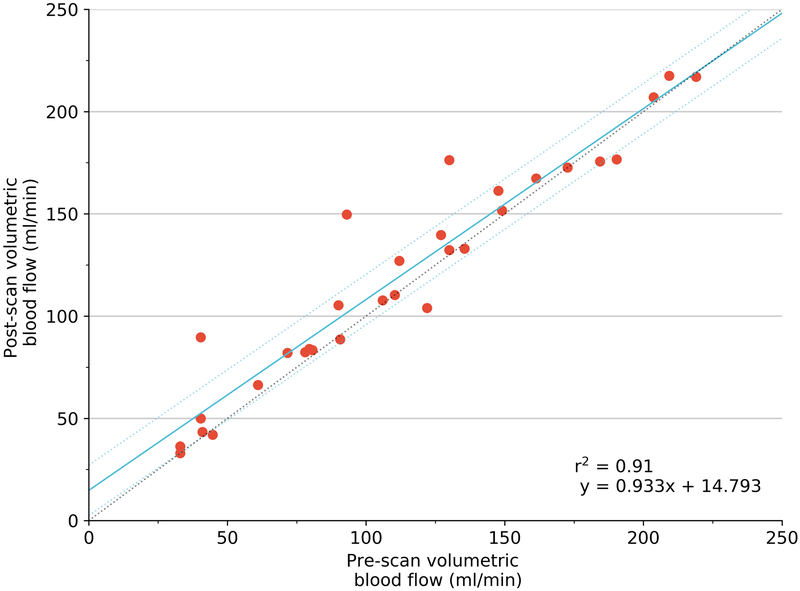
Figure 4.
Regression using generalized estimating equation (blue) with 95% confidence limits (dotted line) of pre- versus post- flow conditions of mean perfusion calculated using FMS (A); pre- versus post- volumetric flow as measured by ultrasonic flow meter (B). Coefficient of determination (r2) provided by simple linear regression. FMS fluorescent microspheres.


