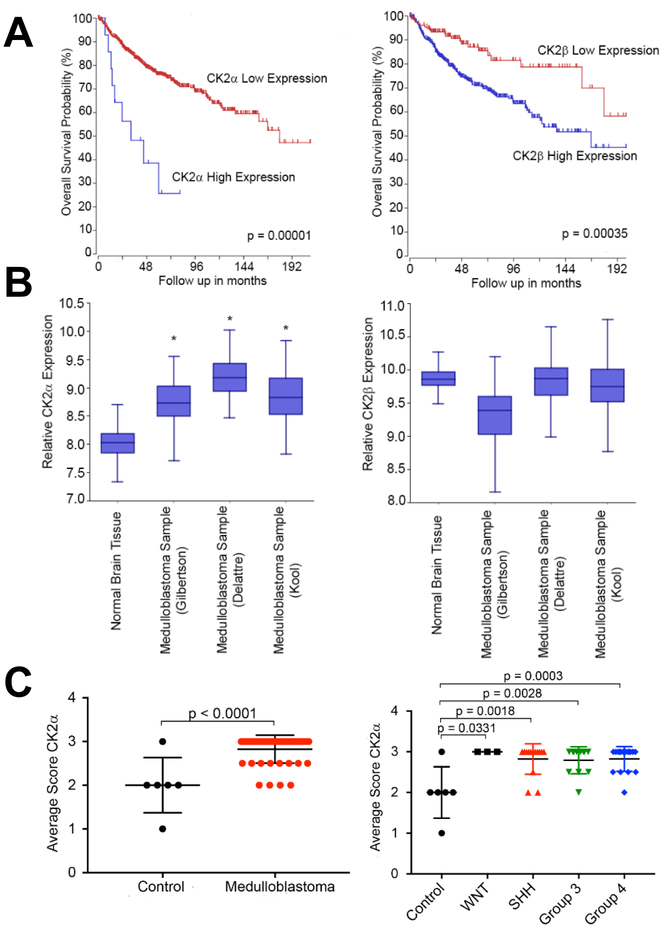
Figure 1. CK2 expression in primary MB patient samples.
A) left- Kaplan Meyer survival curve for MB patients with either high or low CK2α expression. right- Kaplan Meyer survival curve for MB patients with either high or low CK2β expression. N = 612. B) left- The relative mRNA expression level of CK2α in three MB microarray patient samples compared to a normal brain microarray. right- The relative mRNA expression level of CK2β. Boxes represent the interquartile range; lines represent the location of the first quartile, median, and third quartile. The log-rank test was used to calculate p value. * p < 0.05, sample compared to normal brain samples. C) left- Tissue Micro Array (TMA) of primary MB patient samples for CK2α expression. Tonsil and placenta were used as normal tissue control (n=6). right- TMA of primary MB samples separated by molecular subgroup (WNT n=8, SHH n=14, Group 3 n=12, Group 4 n=17). Bars represent mean±SD, two-tailed t-test.

