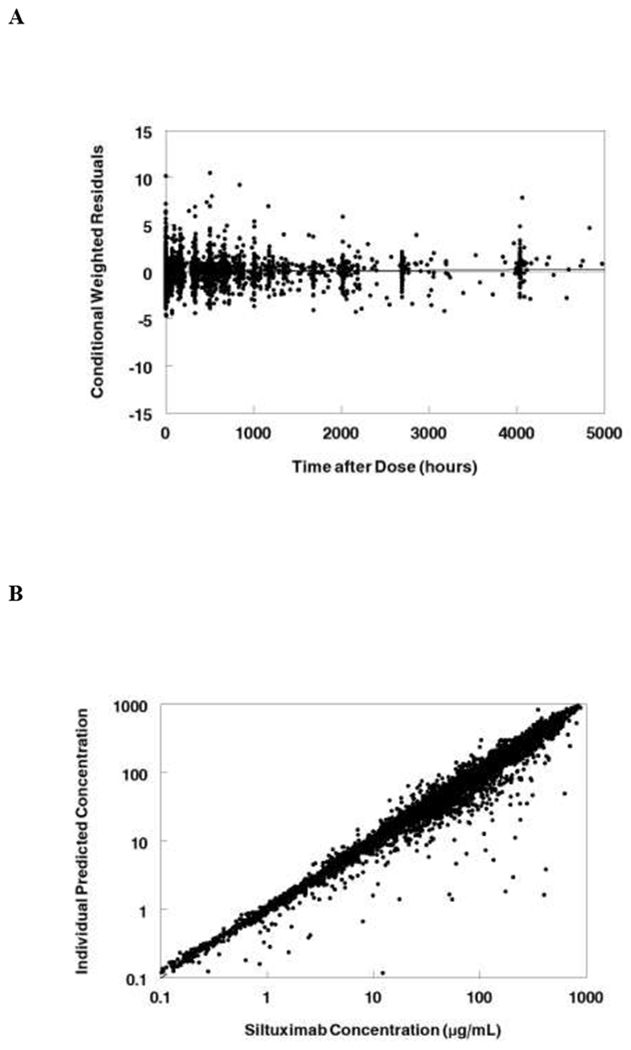
Figure 2:

Diagnostic plots for final population PK model. A. Conditional weight residuals (CWRES) vs. time after dose (hrs). B. Individual predicted siltuximab concentrations vs. measured concentrations. Dashed line represents line of unity. Solid line represents linear regression line. Overall the model represents the data without bias.
