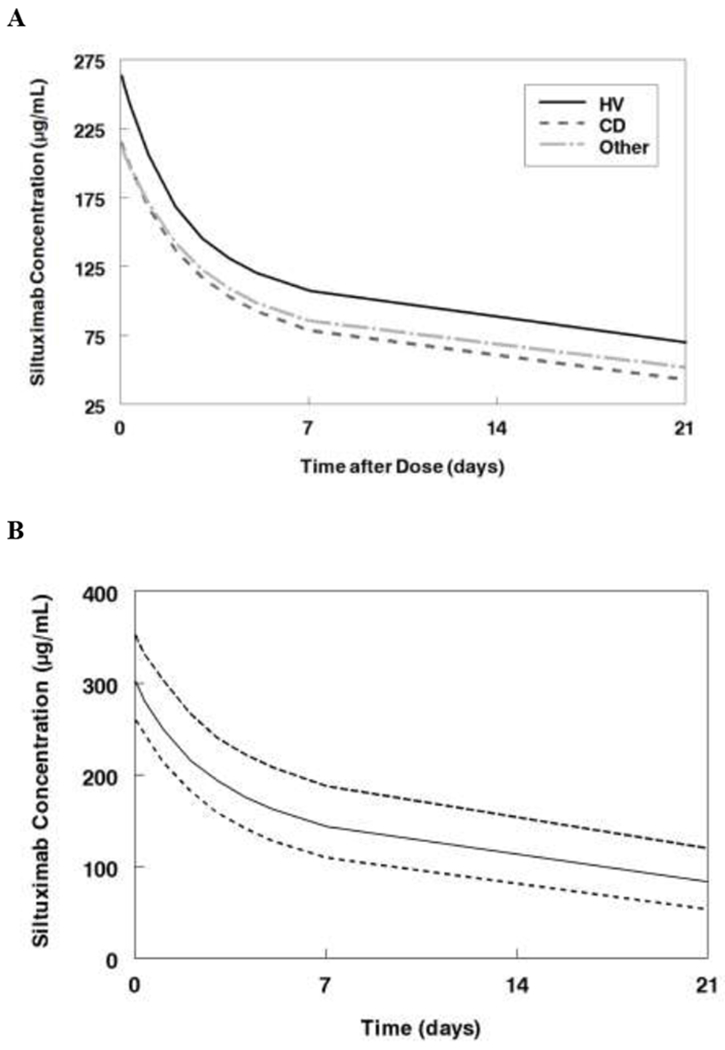
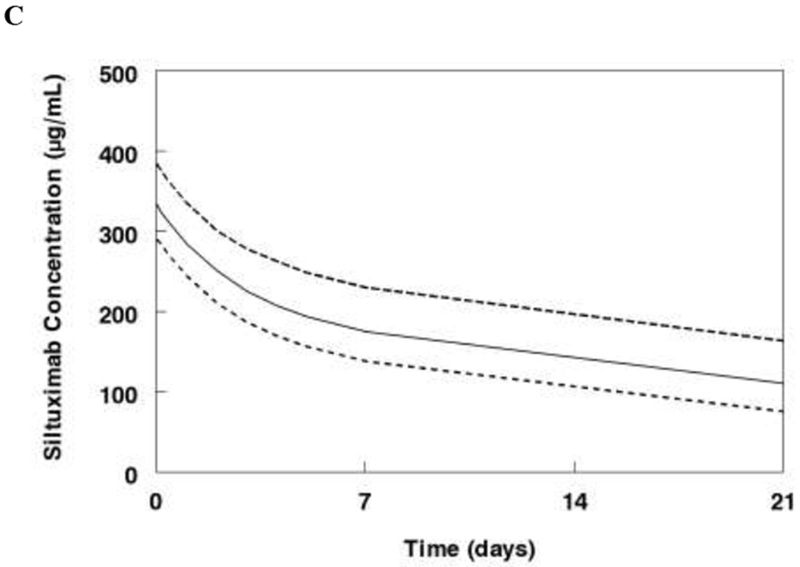
Figure 3:


Monte Carlo simulations of the final model. A. Median concentrations following single dose of siltuximab (11 mg/kg) for a 70 kg subject healthy subject, with Castleman’s disease, or with other tumors. B. Steady state concentrations for Castleman’s disease patients receiving siltuximab 11 mg/kg every 3 weeks. C. Steady state concentrations for patients with other cancers receiving siltuximab 11 mg/kg every 3 weeks. Data represent median and interquartile range (25-75%).
