Figure 3.
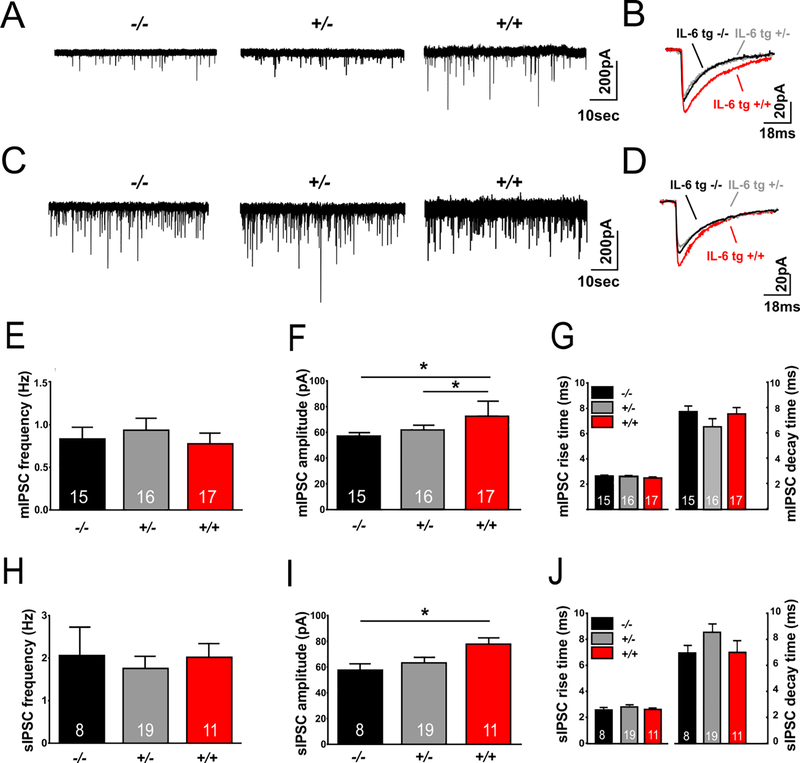
CeA GABA transmission is increased in IL-6 tg +/+ mice. Representative (A) mIPSC and (C) sIPSC recordings from CeA neurons from IL-6 tg −/−, IL-6 tg +/− and IL-6 tg +/+ mice and scaled averages of a representative (B) CeA mIPSC and (D) CeA sIPSC recording are depicted. Data are represented as means ± S.E.M (E) of mIPSC frequencies, (F) mIPSC amplitudes, (G) mIPSC kinetics, (H) sIPSC frequencies, (I) sIPSC amplitudes as well as (J) sIPSC kinetics from 8–19 cells per group from 3 mice for each genotype. Statistical differences between the groups were calculated using one-way ANOVA followed by a post-hoc mean comparison (Tukey’s). (*) indicates a significant difference. The number of cells (n) for each individual group is indicated in the respective bars.

