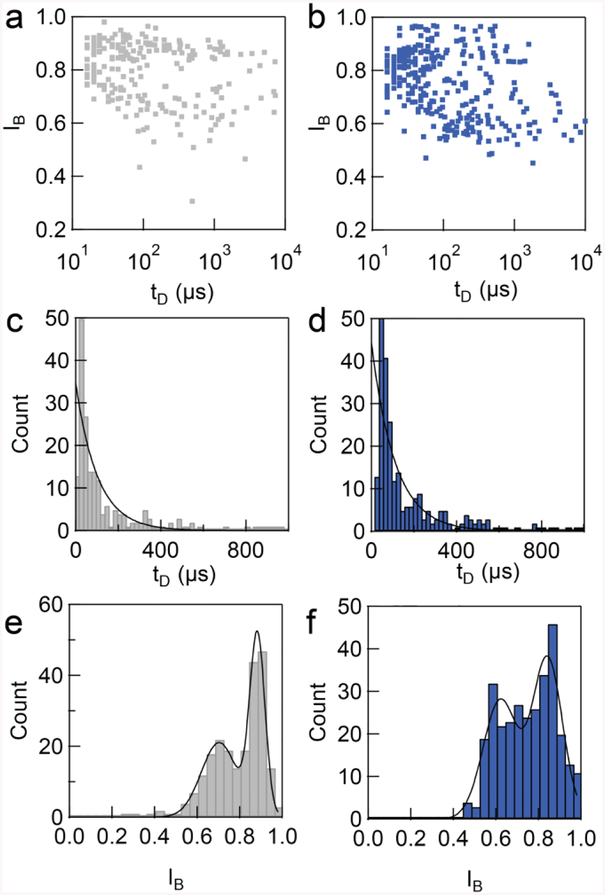
Figure 6.
Analysis of the model 5 kbps DNA translocation events results in translocation dwell time (TD) and fractional current amplitude (IB). Each dot in the scatter pot represents the individual translocation event. a) The scatter plot of translocation events in regular insert, comparing with the translocation events in microfluidic system (b). c) The translocation time histogram inside a regular insert. The histogram was fit with exponential decay to yield the characteristic translocation time of 103 ± 18 μs (N = 231). d) The translocation dwell time of the events in microfluidic chip. Fitting results characteristic dwell time of 111 ± 21 μs (N = 304). The event amplitude histogram shows bimodal distribution which peaks are at 0.70 ± 0.20 and 0.88 ± 0.08 for conventional insert and 0.63 ± 0.20 and 0.86 ± 0.17 for microfluidic insert, respectively. The experiment was done in the same pore. For more experiment in different pores, see SI.

