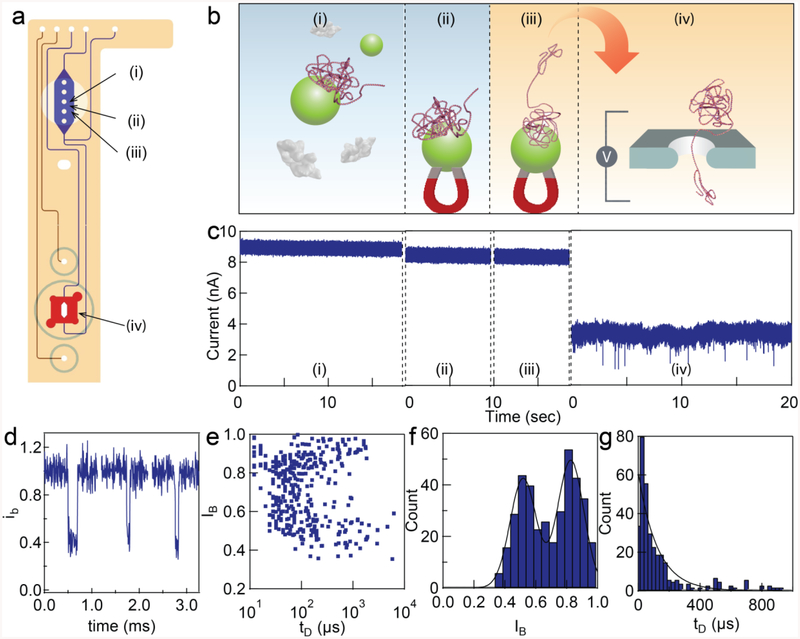
Figure 7.
On-chip PCR purification and nanopore sensing. a) diagram of a nanopore-microfluidic chip. b) A PCR amplicon was generated from lambda DNA template with KOD Hot Start Polymerese and the crude PCR solution was injected into the microfluidic chip for purification. (i) The DNA product from PCR reacted with the silica-coated magnetic nanoparticles inside the reaction chamber. (ii) The magnet is placed on top of the chip to pull down the DNA product. (iii) The beads were washed and released using elution buffer. (iv) The DNA product was sent to the nanopore for detection. c) Representative electrical current measured during each step (i-iv). d) Representative DNA translocation. The y-axis is a current normalized by the open pore current. e-g) Analysis of DNA event’s amplitude and dwell time. The statistics are shown in the main text. The experiment was done in the same pore (4 nm diameter, 5 nm thickness).

