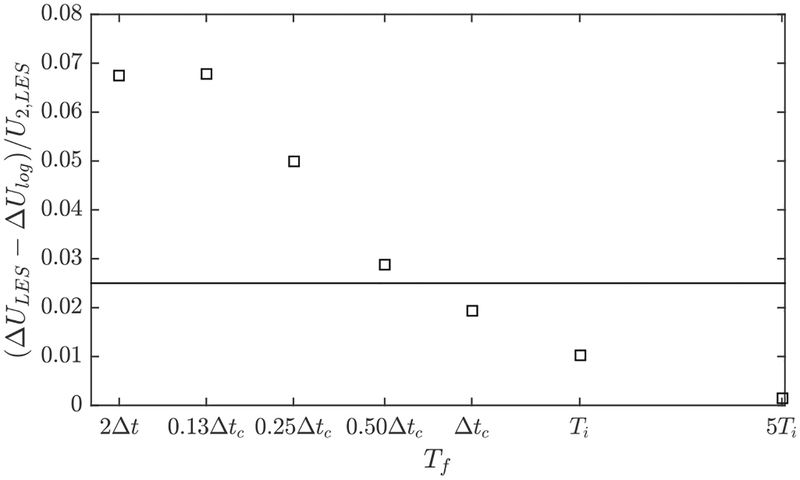
FIG. 3.
Strength of LLM plotted against the filtering time scale. Here Δt is the LES time step size, Δtc = Δx/〈u(y = 0.5Δy)〉, and Ti = hwm/κuτ. The line at 0.025 indicates the expected uncertainty in evaluating the strength of LLM owing to the variation in the von Kármán constant. For the cases shown here, y0 = 0.0001δ, which corresponds to Reτ = 1400.

