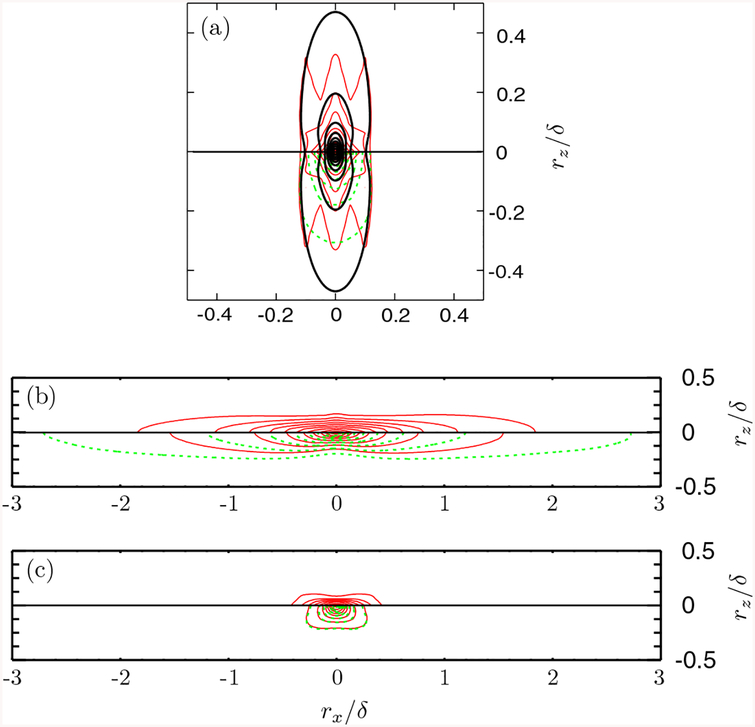
FIG. 6.
Contours of the streamwise-spanwise two-point autocorrelation R(rx,rz): (a) pw, (b) τ1, (c) τ3. Lines in the top half (rz > 0) are from the LES with the NEQWM, and lines in the bottom half (rz < 0) are from the LES with the EQWM. Red solid lines, WMLES with the xz-refined-1 grid; green dashed lines, WMLES with the xz-refined-2 grid; black solid line in panel a, DNS [26,32]. Contour levels from 0.1 to 0.9 with 0.1 increment.

