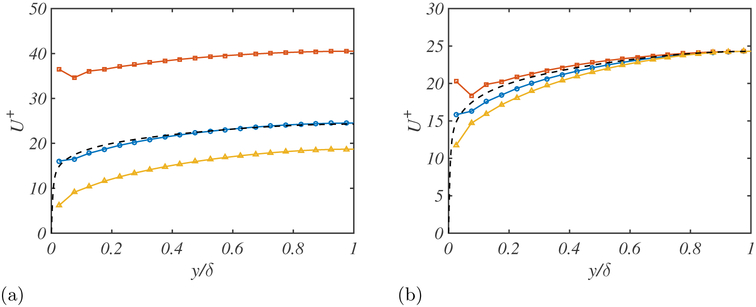
Figure 4.
(a) Effect of different SGS models on the mean velocity profile for lx = ly = 0.005δ. (b) The mean velocity profiles have been shifted to compare the shapes of the mean velocity profile. Dynamic Smagorinsky model (blue circles), constant coefficient Smagorinsky model (yellow triangles), and no SGS model (red squares) are given for the turbulent channel with Reτ = 2000. DNS (black dashed lines).

