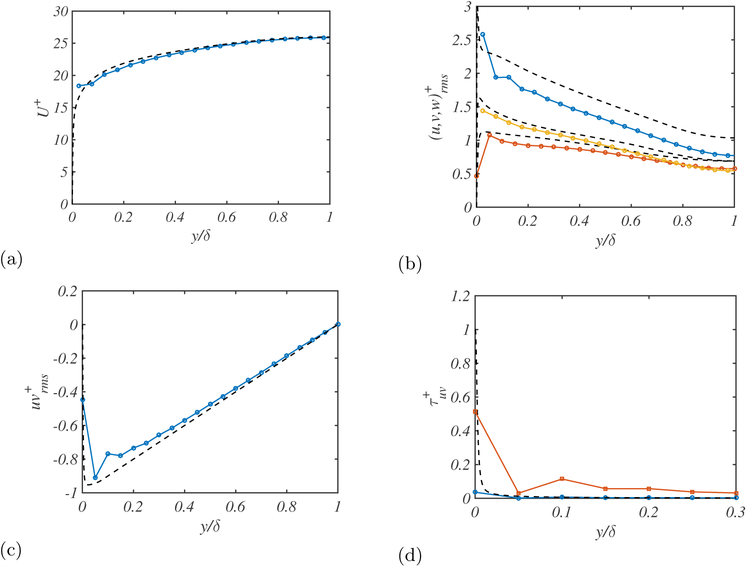
Figure 6.
The (a) mean streamwise velocity profile, (b) root-mean-square streamwise, span-wise, and wall-normal (top to bottom) fluctuation profiles, (c) the uv contribution, and (d) the viscosity contribution (blue circles) and eddy viscosity contribution (red triangles) for the for optimal values of the slip length. DNS (black dashed line).

