
Figure 1.
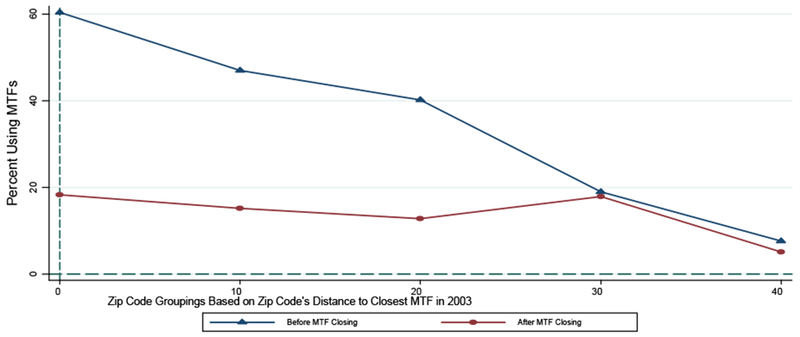
Effect of MTF Closings on Likelihoods of Using Any MTF for Inpatient Care in Regions Affected by Base Closings
Notes: the top line focuses on those encounters in zip codes affected by a base-hospital closing in the period of time prior to the closing. The bottom line focuses on those encounters in zip codes affected by a base-hospital closure in the period of time following the closing. In each case, the indicated point represents the percent of encounters that occur at an MTF as opposed to a civilian hospital, where this percentage is calculated for each of the following groups of zip codes based on their distance to the closest MTF at the beginning of the sample (i.e., in 2003): (1) 0-10 Miles (represented by 0 in the graph), (2) 10-20 Miles (represented by 10 in the graph), (3) 20-30 Miles (represented by 20 in the graph), (4) 30-40 Miles (represented by 30 in the graph), and (5) 40+ Miles (represented by 40 in the graph). Source: 2003-2013 Military Health System Data Repository.