
Figure 2.
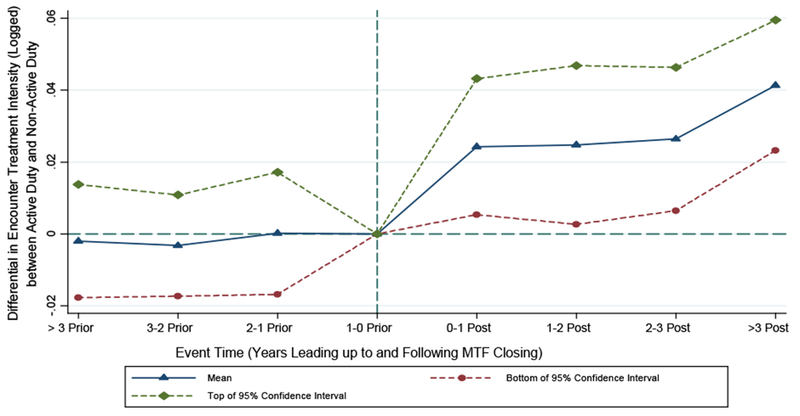
Differential Effect of MTF Closings on Relative Weighted Product (Logged) for Active Duty Relative to Non-Active Duty: Event-Study Analysis
Notes: this figure plots coefficients from a regression that extends the specification estimated in Column 4 of Table A2 to include leads and lags of the closing variable and of the interaction between closing and active-duty-patient status (where the relevant lead/lag variable equals 1 in the indicated period of time and 0 in all other periods). The points in the graph represent the coefficients of the set of leads and logs of the interaction variables. The period of time in the one year preceding the MTF closure is the reference period. Source: 2003-2013 Military Health System Data Repository.