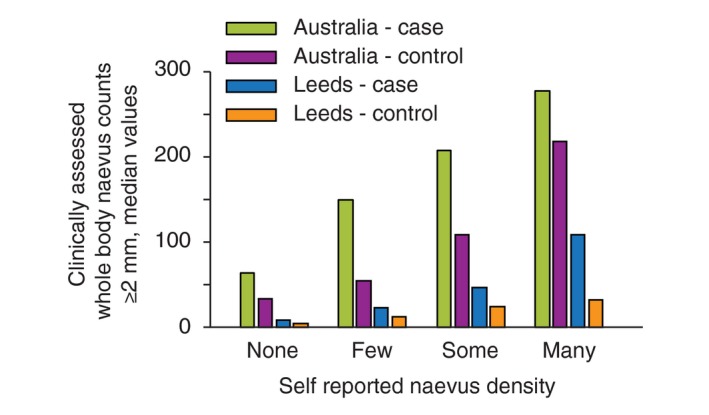
Figure 2.

Comparison of self‐reported and clinically measured naevus counts (≥2 mm) in the Australian Melanoma Family Study and Leeds case–control study. The bar graph plots the median clinically measured naevus counts (y‐axis) according to self‐reported naevus density category (none, few, some, many) (x‐axis), separately for cases and controls in Australia and Leeds.
