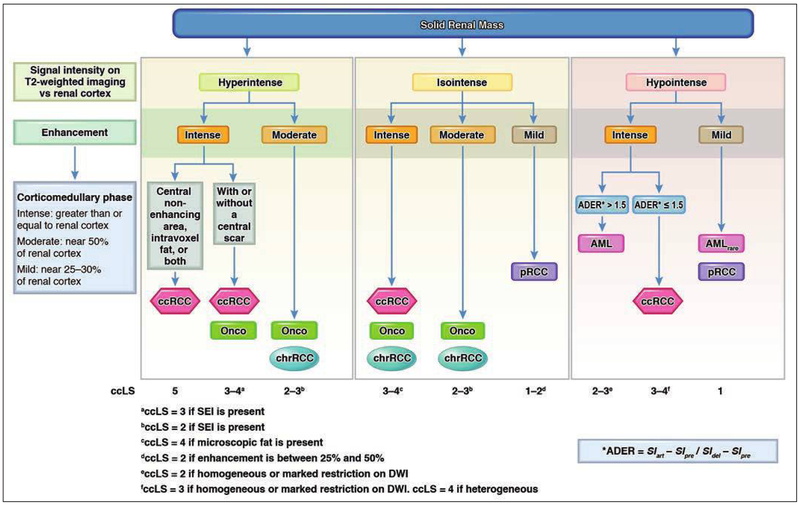
Fig. 4.
Flowchart shows algorithm for characterization of solid renal masses by using imaging features on MRI and assigning clear cell likelihood score (ccLS); ccLS is Likert score that conveys likelihood of clear cell renal cell carcinoma (ccRCC) and is defined as follows: 1, very unlikely; 2, unlikely; 3, equivocal; 4, likely; and 5, highly likely. First step in algorithm is to assess signal intensity of renal mass on T2-weighted images and determine whether mass is hyper-, iso-, or hypointense relative to renal cortex. Masses are then subdivided by degree of enhancement during corticomedullary phase imaging: intense, moderate, or mild. Additional features (e.g., presence of microscopic fat, segmental enhancement inversion [SEI], appearance on DWI) are then used to ultimately assign ccLS value. ADER = arterial-delayed enhancement ratio, AML = angiomyolipoma, AMLrare = angiomyolipoma (rare presentation), pRCC = papillary renal cell carcinoma, Onco = oncocytoma, chrRCC = chromophobe renal cell carcinoma, SIart = signal intensity on arterial phase images, SIpre = signal intensity on unenhanced images, SIdel = signal intensity on delayed phase images (illustration by Moore E). (Adapted from [75] Radiologic Clinics of North America, Vol. 55, Kay FU, Pedrosa I. “Imaging of Solid Renal Masses,” Pages 243–258, Copyright 2018 with permission from Elsevier)

