
Figure 1. Relative RNA levels of SgrS, ptsG and yigL mRNAs under glucose-phosphate stress conditions.
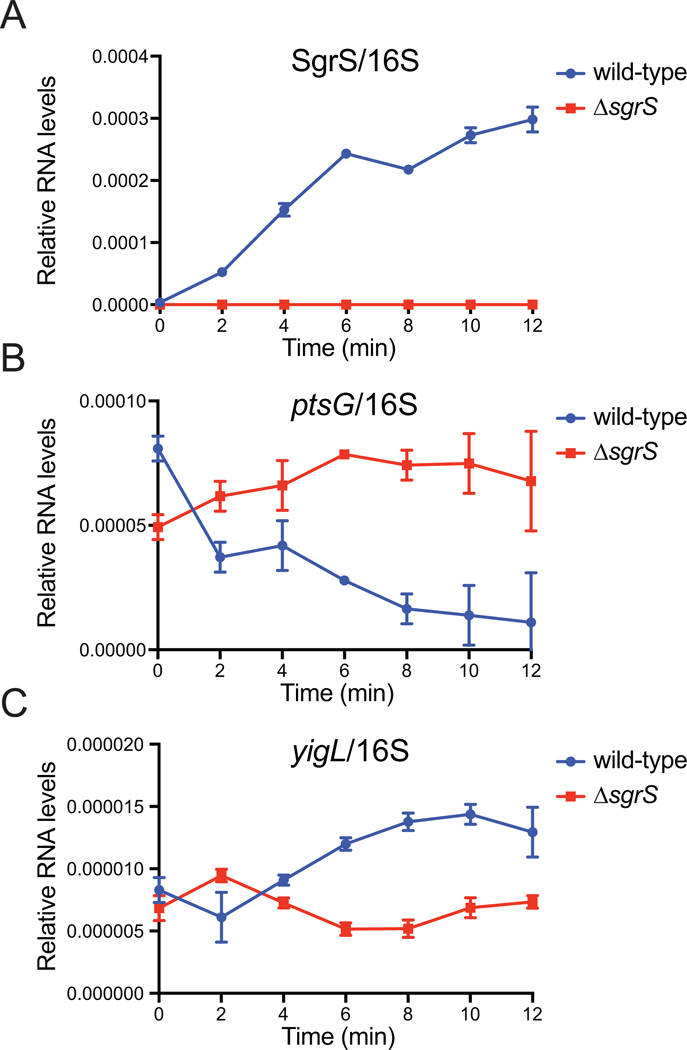
RT-qPCR measuring relative levels of A) SgrS sRNA, B) ptsG mRNA and C) yigL mRNA in the wild-type and ΔsgrS strains after induction of glucose-phosphate stress with 1% αMG. Transcript levels were normalized to rrsA, encoding 16S rRNA in E. coli, and plotted as a function of time.