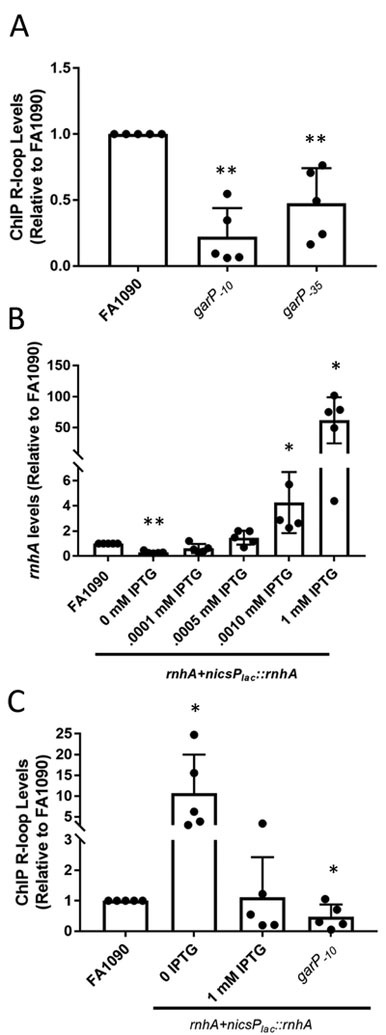
Figure 2.
Transcription and modulation of rnhA modulates R-loop levels
A. R-loop levels of garP−10 and garP−35 strains relative to the parental strain (FA1090). Relative R-loop levels are calculated by determining the percent input after ChIP pulldown for each sample and the dividing by the percent input of FA1090. The reported value represents the mean of five biological replicates (individual dots) +/− one standard deviation as indicated by the error bars. There is no significant difference between garP−10and garP−35 . Unpaired student t-test **p<0.01 *p<0.05
B. The rnhA+nicsPlac::rnhA strain allows modulation of RNase HI. rnhA expression measured using qRT-PCR with Gc grown with different levels of IPTG in solid media. The average fold change compared to FA1090 (±standard deviation) for each IPTG level are: 0 IPTG-0.30 (0.09), 0.001 mM IPTG 0.61 (0.32), 0.005 mM IPTG 1.4 (0.5), 0.01 mM IPTG 4.3 (2.2), 1 mM IPTG 61.9 (33). The reported value represents the mean of five biological replicates (individual dots) +/− one standard deviation as indicated by the error bars. Unpaired student t-test . **p<0.01 *p<0.05
C. R-loop levels determined by R-loop ChIP when rnhA expression is modulated. The reported value represents the mean of six biological replicates (individual dots) +/− one standard deviation as indicated by the error bars. Unpaired student t-test **p<0.01

