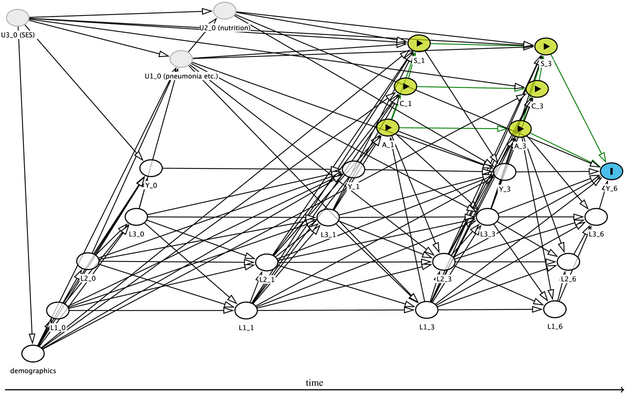
Figure 1.
DAG containing the structural assumptions about the data generating process. The target quantity is ψ6, and relates to Y6 which is represented by the I node. Intervention nodes (here: A1, A3, C1, C3, S1, S3) are represented by yellow nodes and the ▶ symbol. Measured confounders are white, and unmeasured variables are grey. Causal paths for the intervention to the outcome are shown by green arrows.

