Figure 1.
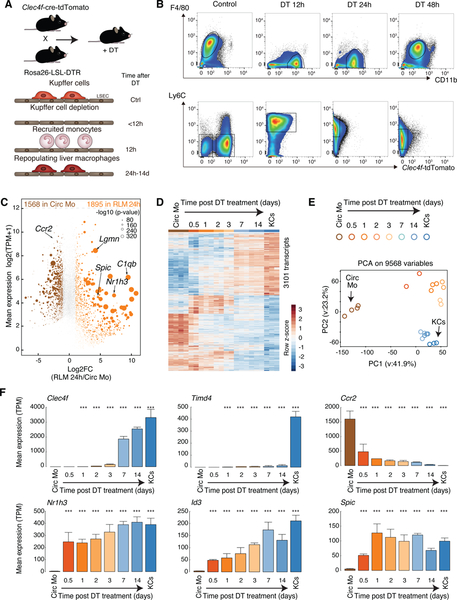
Recruited monocytes rapidly acquire expression of KC LDTFs followed by expression of a subset of KC-specific genes in KC-depleted livers
A. Experimental scheme: Clecf4-cre-tdTomato x Rosa26 LSL DTR +/− DT
B. Flow cytometry analysis of cell populations as a function of time following DT treatment.
C. MA plot of RNA-seq data comparing circulating monocytes and RLMs at 24 h. Data are from one or two experiments with n = 3–4 per group.
D. Genome-wide representation of DE genes in RLMs from 12h to 14 days in comparison to circulating monocytes and resident KCs. Data are from one or two experiments with n = 2–4 per group. DE genes are selected by DESeq2 (p-adj < 0.05).
E. PCA of 9568 detectable genes (at least 8 TPM in at least two samples) in circulating monocytes, recruited liver monocytes, RLMs and resident KCs.
F. Bar plots for expression of indicated genes. The significance symbols represent the p-adj from DESeq2 comparing to circulating monocytes respectively. ***p-adj < 0.001. Data are from one or two experiments with n = 2–4 per group. See also Figure S1.

