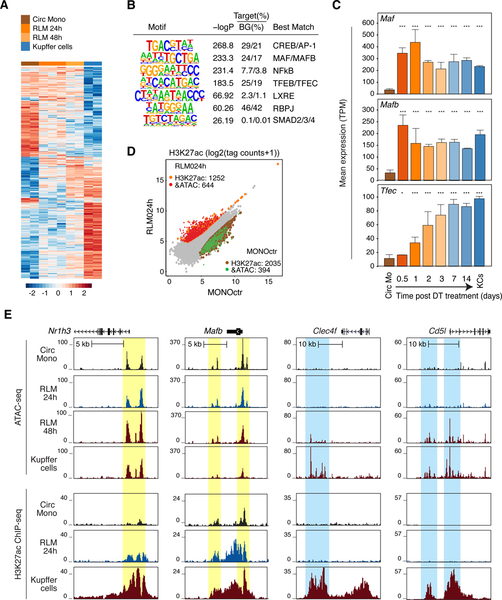
Figure 2.
Rapid reprogramming of the RLM epigenetic landscape
A. Heat map of distal accessible chromatin regions defined by ATAC-seq in circulating monocytes, RLMs at 24 and 48h, and KCs. Each row is Z-score normalized tag counts for a peak. Data are from one or two experiments with n = 2–3 per group.
B. Enriched motifs in distal accessible chromatin regions defined by ATAC-seq of RLMs at 48 h using GC-matched genomic background.
C. Bar plots for expression of indicated genes in circulating monocytes (Circ Mo), RLMs, and resident KCs. Data are from one or two experiments with n = 2–4 per group. The significance markers represent the p-adj from DESeq2 comparing to circulating monocytes respectively. *p-adj < 0.05; ***p-adj < 0.001.
D. Scatter plot of distal ATAC-associated H3K27ac in RLMs at 24h vs circulating monocytes. Data are from one or two experiments with n = 2–3 per group. Color codes indicate significant changes (p-adj < 0.05 & FC > 2) in H3K27ac with or without significant changes in ATAC-seq peaks.
E. Genome browser tracks of ATAC-seq and H3K27ac ChIP peaks in the vicinity of the indicated loci in blood monocytes (Circ Mono), RLMs at 24 and 48 h and KCs. Yellow shading; pre-existing ATAC-seq peaks in circulating monocytes. Blue shading; regions of open chromatin acquired during RLM differentiation. See also Figure S2.

