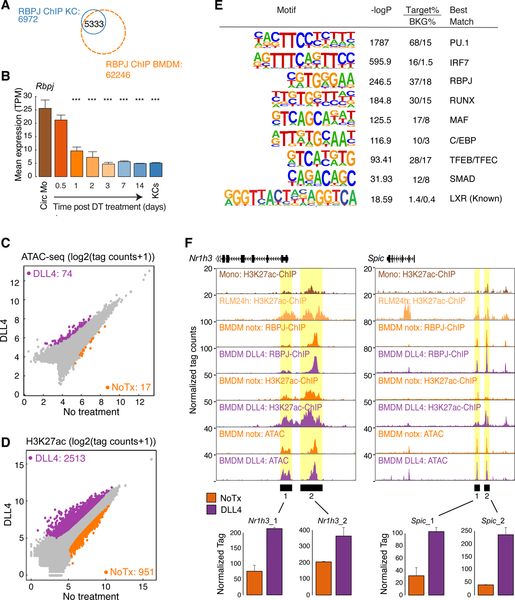
Figure 6.
Notch signaling activates a pre-existing enhancer landscape in BM progenitor cells
A. Overlap of reproducible RBPJ ChIP-Seq peaks in KCs and BM progenitor cells
B. Bar plot for Rbpj expression in circulating monocytes (Circ Mo), RLMs, and resident KCs. Data are from one or two experiments with n = 2–4 per group. The significance symbols represent the p-adj from DESeq2 comparing to circulating monocytes respectively. ***p-adj < 0.001.
C. Scatter plot of IDR-defined distal ATAC-peaks in DLL4-treated BMDMs vs. control BMDMs. Data are from one experiment with n = 2 per group. Significantly-changed ATAC-peaks (p-adj < 0.05 & FC > 2) are colored (purple: gained; orange: reduced in DLL4-treated BMDM).
D. Scatter plot of distal ATAC-associated H3K27ac in DLL4-treated BMDMs vs control BMDMs. Data are from one experiment with n = 2 per group. Color codes indicate significant changes (p-adj < 0.05 & FC > 2) in H3K27ac.
E. Motif enrichment analysis of distal ATAC-seq peaks in DLL4-treated BMDMs that gain H3K27ac.
F. Browser tracks of ATAC-Seq, H3K27ac ChIP-seq and RBPJ ChIP-seq peaks in the vicinities of putative regulatory elements for the indicated genes (Yellow shading). Bar graphs illustrate H3K27ac normalized tag counts for the indicated genomic regions. See also Figure S6.

