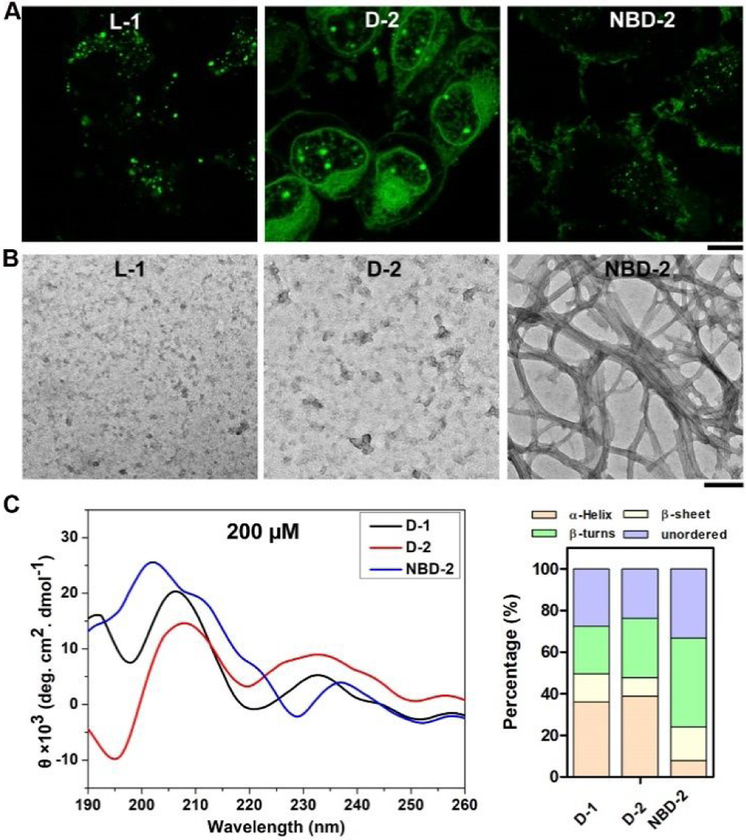
Figure 2.
Fluorescent images T98G cells treated with (A) L-1, D-2, or NBD-2 for 2 h. Scale bar is 10 μm. (B) TEM images of the assemblies of L-1, D-2, or NBD-2. The concentration of all the molecules is 200 μM. Scale bar is 100 nm. (C) CD spectra of D-1, D-2, and NBD-2 at the concentration of 200 μM, and the percentage of secondary structures at the concentration of 200 μM.

