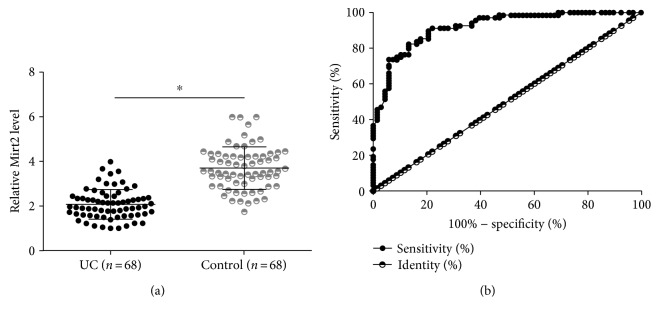
Figure 1.
Plasma Mirt2 was downregulated in UC and showed diagnostic values. Mirt2 in plasma of the patient (n = 68) and control (n = 68) groups was detected by performing RT-qPCR, followed by data analysis using the unpaired t-test. Mirt2 levels in plasma were significantly lower in the patient group than in the control group (a), (∗p < 0.05). ROC curve analysis showed that downregulation of Mirt2 in plasma of UC patients distinguished UC patients from healthy controls (b).

