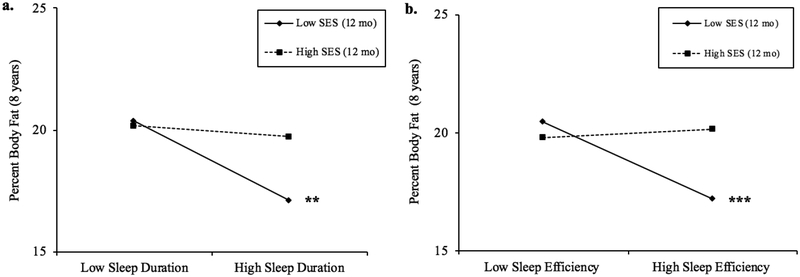
Figure 3.
a. Simple slope plots for percent body fat by levels of average sleep duration (hours) for high (+1SD) and low (−1SD) levels of SES. Simple slope associations between sleep duration and percent body fat were significant for children with low SES (b = −2.31, p < .01) and average SES (b = −1.29, p = .01). Region of significance analyses indicate that simple slopes were significant for families with SES scores less than .18 or about 60.2% of the sample. b. Simple slope plots for percent body fat by levels of average sleep efficiency (%) for high (+1SD) and low (−1SD) levels of SES. Simple slope associations between sleep efficiency and percent body fat were significant for children with low SES (b = −.29, p < .001). Region of significance analyses indicate that simple slopes were significant for families with SES scores less than - .04 or about 47.8% of the sample.

