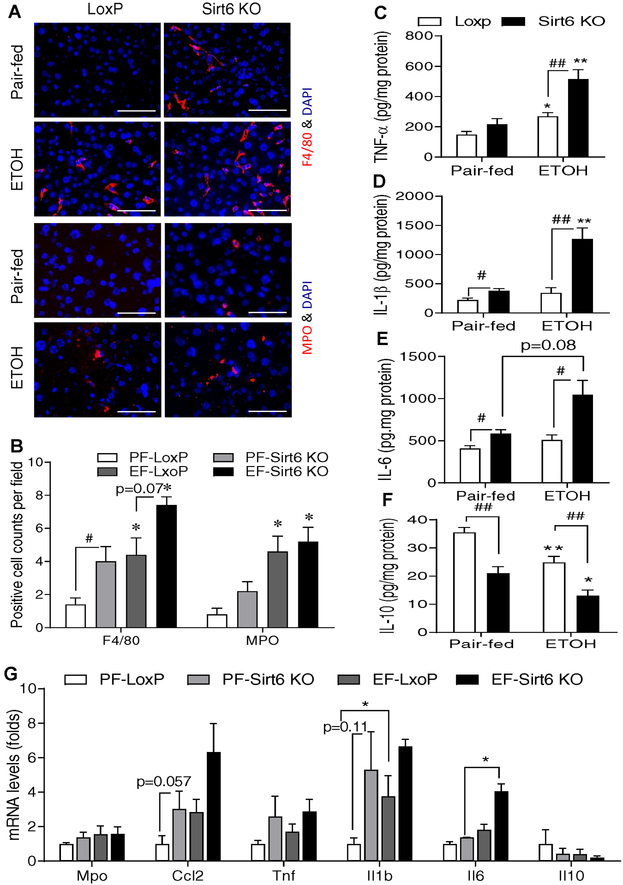
Fig. 2. Ethanol-induced inflammation is worsened in hepatic Sirt6 deficient mice.
Control LoxP and Sirt6 KO male mice were pair-fed or ethanol-fed (6% vol/vol) for 15 days plus a single binge (6 g/kg) on day 16. (A) Representative immunofluorescent staining of F4/80 and MPO in mouse liver sections. (B) Quantification of positive staining cells in Panel A. (C-F) Hepatic cytokine measurements: TNF-α (C), IL-1β (D), IL-6 (E), and IL-10 (F). (G) mRNA analysis of inflammation related genes in the liver of control LoxP and Sirt6 KO mice by qPCR. Data are presented as means ± S.E.M. #p < 0.05 and ##p < 0.01 for LoxP vs. Sirt6 KO; *p < 0.05 and **p < 0.01 for Pair-fed vs. ETOH for the same genotype (n=4–6/group). IF images were obtained using a fluorescence microscope (400× magnification). Scale bars: 50 μm. MPO, myeloperoxidase; qPCR, quantitative PCR.

