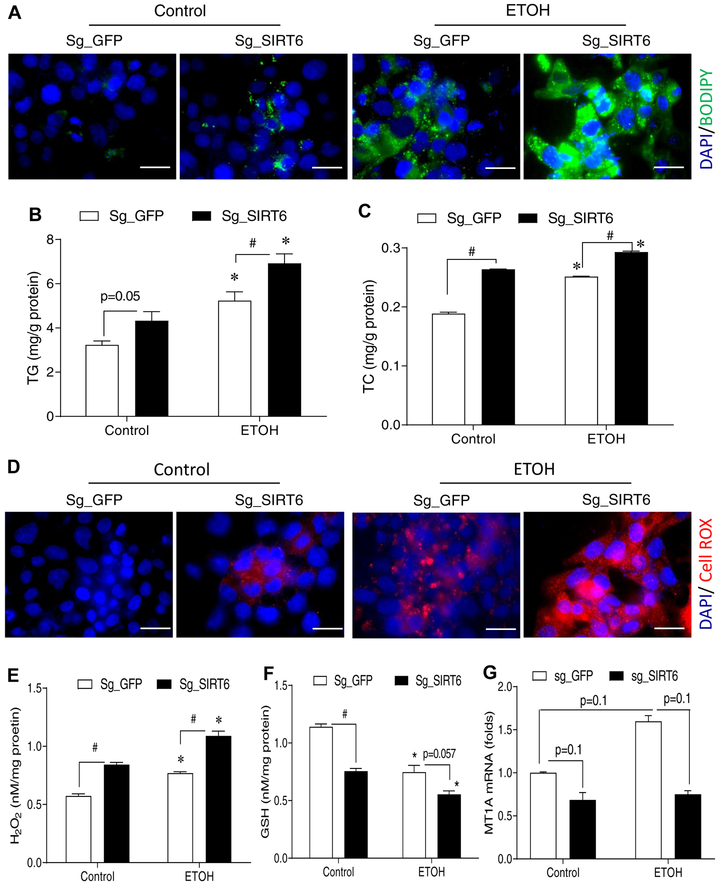
Fig. 4. Knockdown of SIRT6 in an ALD cell model leads to lipid dysregulation and oxidative stress.
(A) BODIPY staining of neutral lipids in VL-17A cells that were transduced with control sg_GFP or sg_SIRT6 lentiviruses. (B, C) Cellular TG and TC measurements. (D) ROS detection by CellROX fluorescent probe in live VL-17A cells. (E-G) VL-17A cells were either not treated or treated with 50 mM ethanol for 48 hrs before they were harvested for measurements of intracellular H2O2 (E), GSH (F), or MT1A mRNA (G). Data were presented as mean ± S.E.M (n = 3–4/group). #p < 0.05 for sg_GFP vs. sg_Sirt6; *p < 0.05 for Control vs. ETOH for the same sgRNA. Fluorescence images were obtained using a fluorescence microscope (630× magnification). Scale bars: 10 μm. GSH, glutathione; ROS, reactive oxygen species; TC, total cholesterol; TG, triglyceride.

