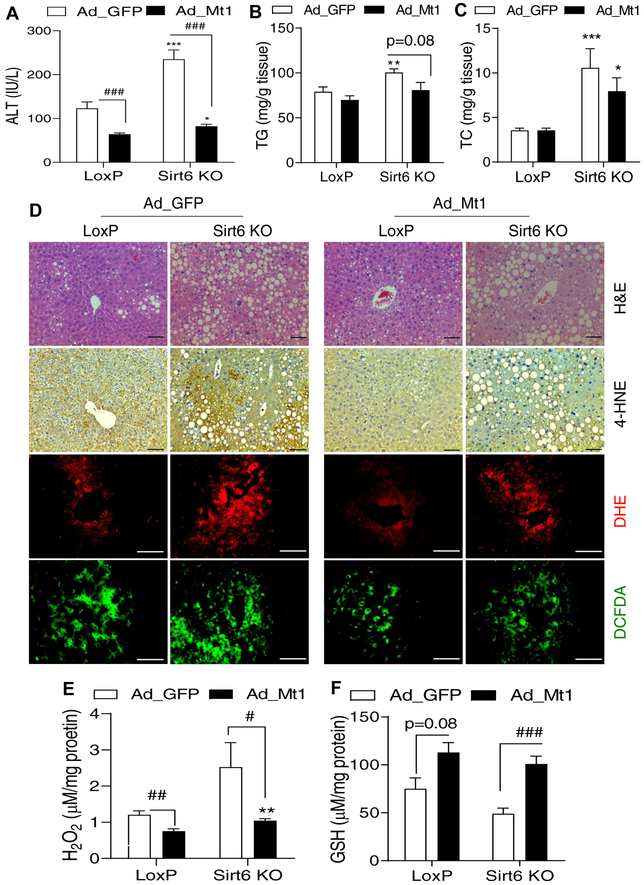
Fig. 5. Hepatic Mt1 overexpression ameliorates ethanol-induced oxidative stress in the liver.
Control LoxP and Sirt6 KO male mice were pair-fed or ethanol-fed (6% vol/vol) for 15 days plus a single binge (6 g/kg) on day 16. Adenoviral vectors were injected on day 12 of ethanol feeding. (A) Serum ALT levels. (B, C) Hepatic TG and TC measurements. (D) H&E staining, IHC analysis of 4-HNE, and fluorescence analysis of ROS using DHE and DCFDA dyes in mouse liver sections. (E, F) Hepatic H2O2 and GSH measurements. Data were presented as mean ± S.E.M (n = 8/group). #p < 0.05, ##p < 0.01, and ###p < 0.001 for Ad_ GFP vs. Ad_Mt1; *p < 0.05, **p < 0.01, and ***p < 0.001 for LoxP vs. Sirt6 KO for the same adenoviral vector. Images were captured by light microscopy for H&E and IHC staining (200× magnification), and fluorescence images were obtained using a fluorescence microscope (200× magnification). Scale bars: 50 μm. ALT, alanine transaminase; DCFDA, dichlorofluorescin diacetate; DHE, dihydroethidium; GSH, glutathione; 4-HNE, 4-hydroxynonenal; IHC, immunohistochemistry; qPCR, quantitative PCR; ROS, reactive oxygen species; TC, total cholesterol; TG, triglyceride.

