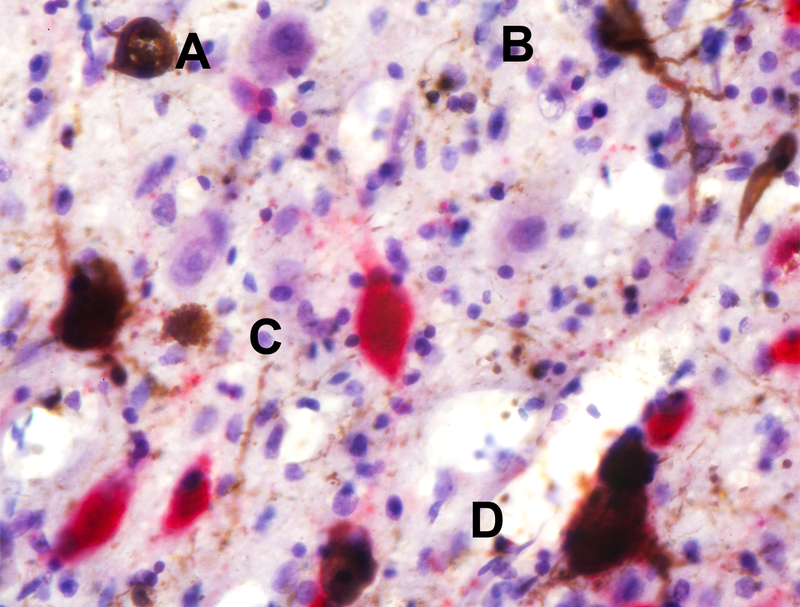
Figure 1. Neuronal Classification Using Double Staining Immunohistochemistry.
The figure depicts an example of how the neurons were classified. (A) A neuron negative for p-tau and not expressing the neurotransmitter of interest (shown in purple); (B) a neuron positive for phospho-tau only (in brown); (C) a neuron positive for neurotransmitter only (in this case, orexin; in red); (D) a neuron positive for both phospho-tau and neurotransmitter of interest (orexin). This photo was taken from the lateral hypothalamic area from a case with Alzheimer’s disease. The black bar represents 100 μm.

