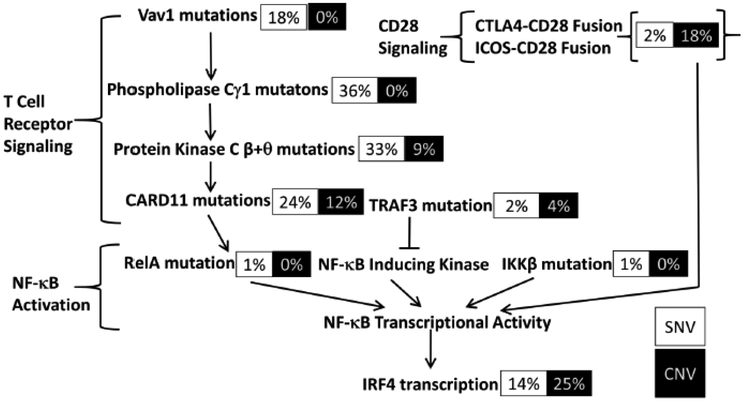
Fig 2.
TCR Activation Pathway in ATLL. The figure depicts percentage of cases in which eachin the pathways is mutated in ATLL. SNVs are depicted in black font, CNVs in white font. Reprinted with permission from reference50. This research was originally published in Journal of Biological Chemistry. (c) the American Society for Biochemistry and Molecular Biology.

