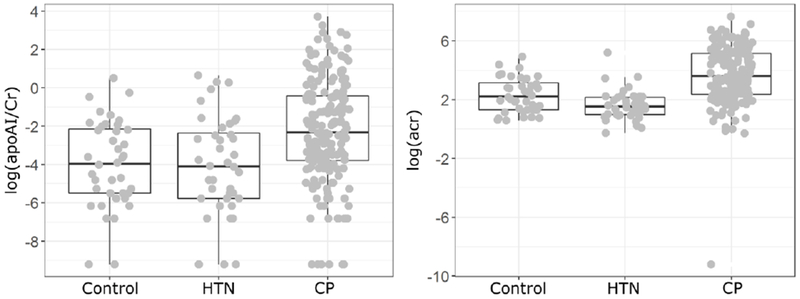
Figure 1.

A. Urinary excretion of apoAI in clinic patients (CP) and controls.
CP does not include hypertension patients seen in clinic. Wilcoxon rank sum test p=0.0001. The lower quartile, median, and upper quartile are shown by the Boxplot. The whisker was extended to 1.5 times of Interquartile Range (IQR). For those with apoAI=0, a value of 0.0001 was assigned for logarithmic transformation shown as the minimum in the graph. B. Urinary excretion of albumin in CP and controls. Wilcoxon rank sum test p <0.0001. For those with ACR=0, a value of 0.0001 was assigned for logarithmic transformation shown as the minimum in the graph.
