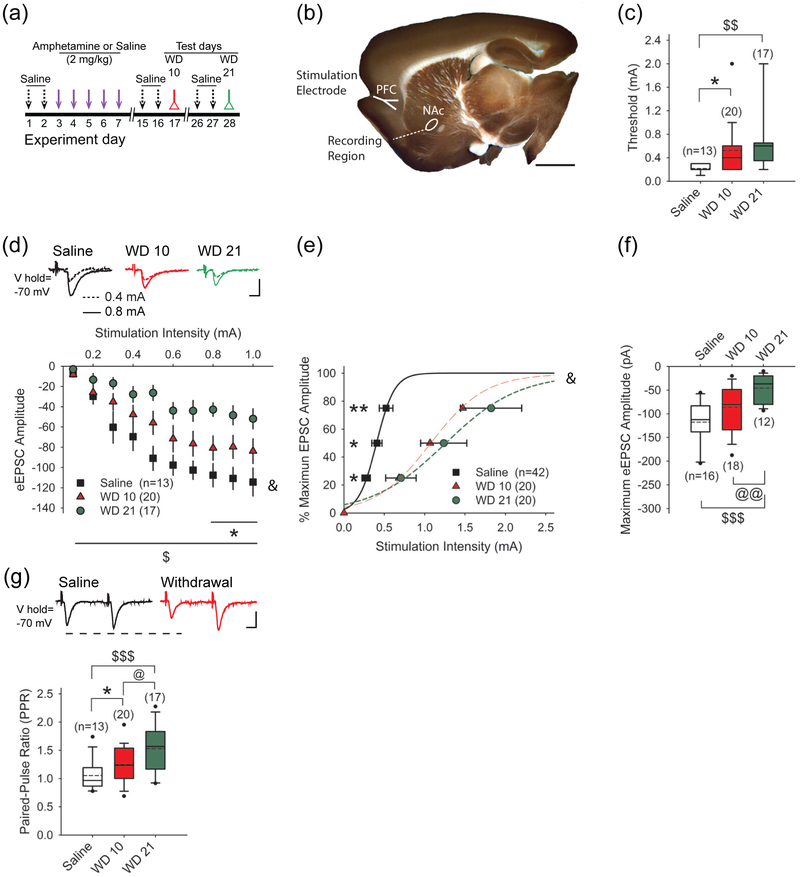
FIGURE 1.
Repeated amphetamine produces a stimulation-dependent synaptic depression in the NAcore. (a) Paradigm for testing synaptic plasticity following repeated amphetamine. Amphetamine-treated mice were injected with saline for 2 days and amphetamine for 5 days, while saline-treated mice received saline instead of amphetamine. Amphetamine and saline-treated mice were sacrificed for experiments on WD 10 or WD 21. To separate the effects of novelty from the pharmacological effects of the drug, amphetamine- and saline-treated mice used for the combined behavioral and optical experiments also received saline injections on days 1, 2, 15, 16, 26, and 27. (b) A sagittal corticoaccumbal slice, stained with FM1-43 and 3,3’-diaminobenzidine, demonstrates the areas of stimulation and recording. Bar: 3 mm. (c) The cortical stimulation current required to reach eEPSC threshold in SPNs from amphetamine-treated mice on WD 10 and WD 21 was greater than that required in cells from saline-treated mice. Box-and-whisker plots: boundary, 25th and 75th percentiles; median, solid black line; mean, dashed line; whiskers, 10th and 90th percentiles; outlying points, circles. For all panels, *p<0.05, **p<0.01, saline vs. WD 10, 2-tailed Student’s t-test; $p<0.05, $$p<0.01, $$$p<0.001, saline vs. WD 21, 2-tailed Student’s t-test; @p<0.05, WD10 vs. WD 21, 2-tailed Student’s t-test. The number of cells (n) is indicated in parenthesis. (d) Representative traces (above) and input-output curves (below) show that cortical stimulation produced lower amplitude eEPSCs in SPNs on WD 10 and WD 21. &p<0.05, 2-way ANOVA for interaction between stimulation intensity and treatment. Bars: 100 pA, 5 ms. (e) The cortical stimulation intensity required to achieve 25%, 50%, and 75% of maximum eEPSC amplitude was greater in SPNs from amphetamine-treated mice on WD 10 and WD 21. &p<0.05, 2-way ANOVA for interaction between stimulation intensity and treatment. Curves were fit with a Hill equation. (f) The graph shows that the maximum eEPSC amplitude is lower in SPNs from amphetamine-treated mice on WD 10 and WD 21. Bars: 100 pA, 5 ms. (g) Representative traces (above) and graph show that the PPR is higher in SPNs from amphetamine-treated mice in withdrawal, compared to saline-treated mice.

