Figure 5.
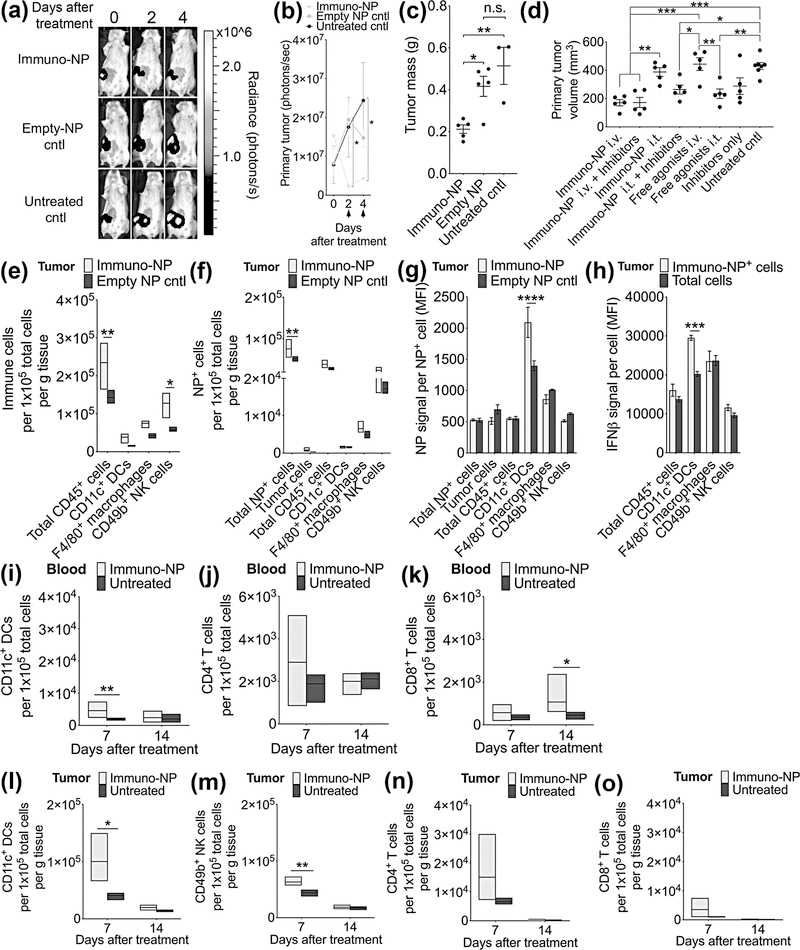
Immuno-NP treatment results in a substantial reduction in primary tumor mass with DC and NK cell effectors in the 4T1 model. (a) Representative bioluminescence images of 4T1 tumor-bearing mice from 3 treatment groups (immuno-NPs, empty NPs as vehicle control, and untreated controls) treated twice 2 days apart with tumors removed surgically 4 days after the start of treatment. Units of radiance are photons/s. Black arrows along x-axis designate treatment days. (b) Quantification of primary tumor cell luminescence as treatment was monitored. Nanoparticle groups had 5 mice per group while untreated control group had 3 mice. (c) Quantification of masses of excised tumors 4 days after the start of treatment. (d) Primary tumor volume measurements on day 5 after the start of treatment (N=5 mice per group). Flow cytometry analysis of immune cells per gram of tumor tissue (e), NP+ cells (f), NP signal per NP+ cell (g), and IFNβ per cell (h) (N=4 mice per group). Flow cytometry analysis of blood DCs (i), CD4+ T cells (j), and CD8+ T cells (k), and tumor DCs (l), NK cells (m), CD4+ T cells (n), and CD8+ T cells (o) (N=4 mice per group). Mean ± standard error are plotted with statistics by 1-/2-way ANOVA with Tukey’s post-test (* P<0.05, ** P<0.01, *** P<0.001).

