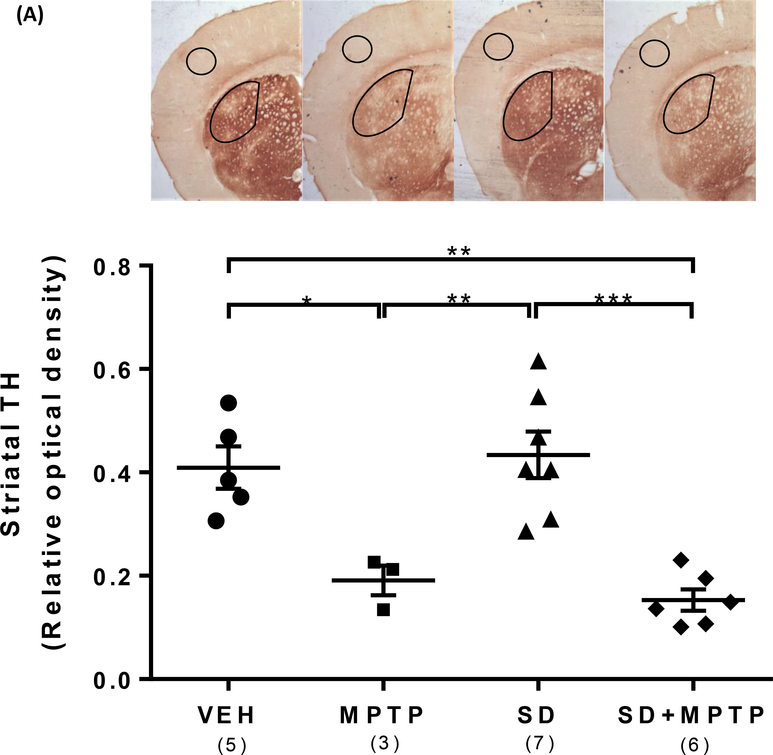
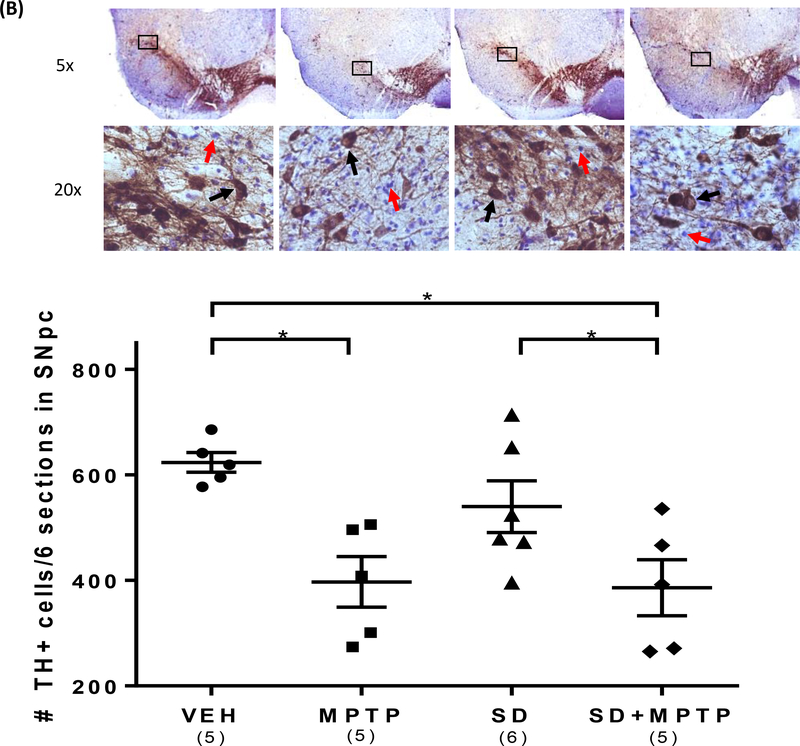
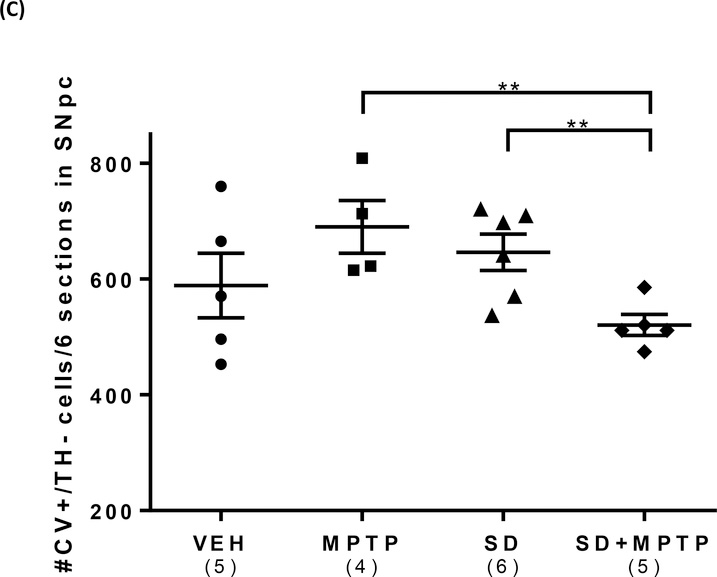
Fig. 2: TH Immunohistochemistry (IHC) of the striatum and substantia nigra pars compacta (SNpc).
(A) IHC analysis of the dorsolateral striatum showed a 53% decrease (p=0.018) and a 65% decrease (p=0.005) in TH optical density in both the MPTP and SD+MPTP groups compared to the VEH and SD groups, respectively. Representative photos of the striatum from each group are shown above the graph with the analyzed area of the striatum and cortex circled. (B) TH+/dopamine cell counts of the SNpc showed a 36% decrease (p=0.0036) and a 38% decrease (p=0.0021) in both the MPTP and SD+MPTP groups compared to the VEH and SD groups, respectively. Photos of TH labeled SNpc from each treatment group are shown above the graph at 5x and 20x magnification (black arrows point to TH-ir SNpc neurons and red arrows point to Cresyl Violet SNpc neurons). (C) Cell counts of cresyl violet positive (CV+)/TH negative (TH−) neurons within the SNpc. There was a significant decrease in the number of CV+/TH− neurons in the SD and SD+MPTP groups compared to the MPTP only group (p<0.03). Overall, there was no evidence of enhanced striatal TH terminal or TH+ cell loss in the SNpc in the SD+MPTP group compared to the MPTP group. Values are presented as the mean ± SEM of group averages. The symbols in each column refer to values from each animal. The number of animals used is in parentheses below the treatment group. * − p<0.05; ** − p<0.01; *** − p<0.001.


