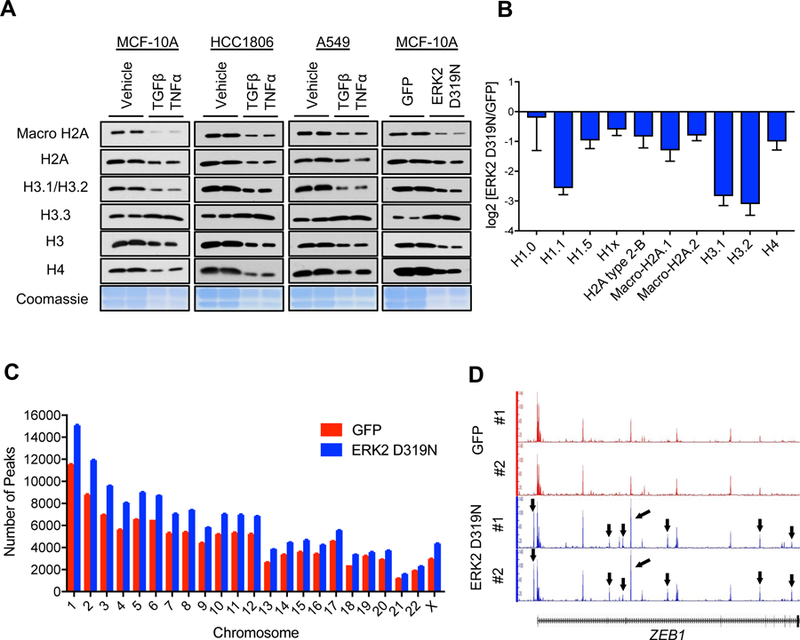
Figure 1. EMT induction promotes a global decline in histone levels promoting H3.3-mediated gap filling and increasing chromatin accessibility.

(A) Levels of various histones and Coomassie Blue stain of total histones in histone extracts of cells treated with TGFβ + TNFα (MCF-10A for 5 days, HCC1806 and A549 for 10 days) or MCF-10A expressing ERK2 D319N inducibly for 3 days; representative images (n = 4).
(B) Histone quantification by mass spectrometry in MCF-10A expressing ERK2 D319N inducibly for 3 days (n = 3). All values are expressed as mean ± SEM.
(C and D) Summary of genome-wide nucleosome occupancy showing distribution of detected peaks on chromosomes (All values are expressed as mean ± SEM) (C), and signal tracks for ZEB1 (D) determined by ATAC-seq in MCF-10A expressing ERK2 D319N inducibly for 3 days; arrows indicate the presence of novel peaks.
