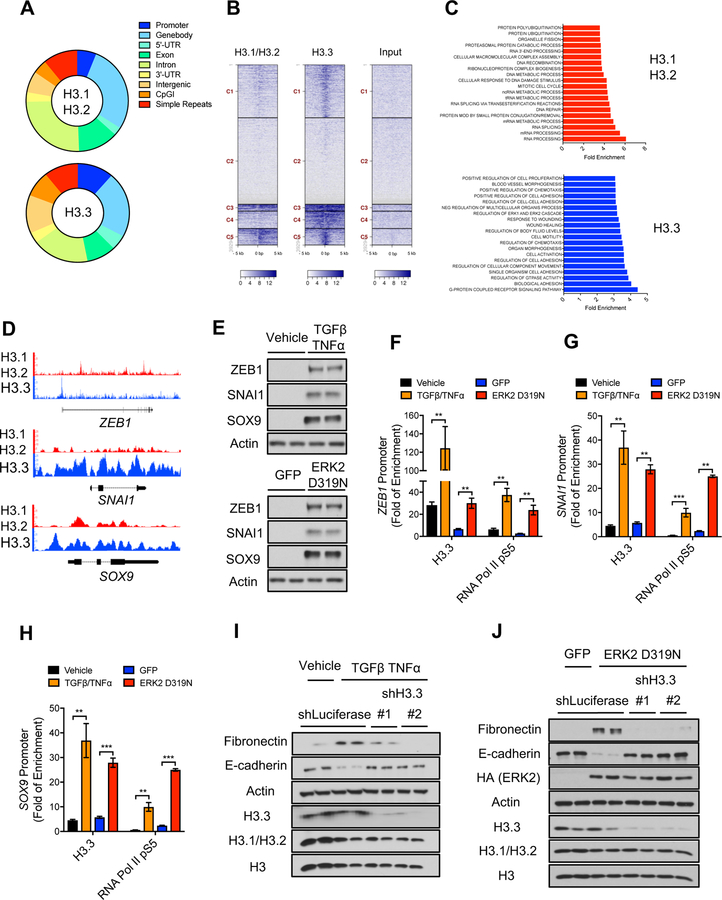
Figure 2. Histone H3.3 mediates metastatic traits by regulating aggressive factors.
(A-D) Summary of H3.1/H3.2 and H3.3 ChIP-seq analysis in LM2 cells showing genomic distribution of H3.1/H3.2 and H3.3 peaks (A), density heat maps of H3.1/H3.2 and H3.3 peaks across transcriptional starting sites (TSS) (Darker blue indicates higher enrichment) (B), GSEA analysis of genes enriched for H3.1/H3.2 or H3.3 (C), and H3.1/H3.2 and H3.3 signal tracks (D).
(E) Levels of the EMT-inducing transcription factors ZEB1, SNAI1 and SOX9 in MCF-10A treated with TGFβ + TNFα for 5 days or expressing ERK2 D319N for 6 days after transduction; representative images (n = 4).
(F-H) H3.3 and RNA Pol II pS5 enrichment at the ZEB1 (F), SNAI1 (G) and SOX9 (H) promoters in MCF-10A treated with TGFβ + TNFα or expressing inducible ERK2 D319N for 3 days; fold enrichment was determined using IgG as a control for the ChIP (n = 4). All values are expressed as mean ± SEM (**p < 0.01, ***p < 0.001).
(I and J) EMT induction determined by protein levels of the mesenchymal marker fibronectin and the epithelial marker E-cadherin after treatment with TGFβ + TNFα for 5 days (I) or expression of ERK2 D319N for 6 days after transduction (J) in MCF-10A with H3.3 knockdown; histone levels are detected in whole cell lysates to show knockdown efficiency of H3.3; representative images (n = 4).

