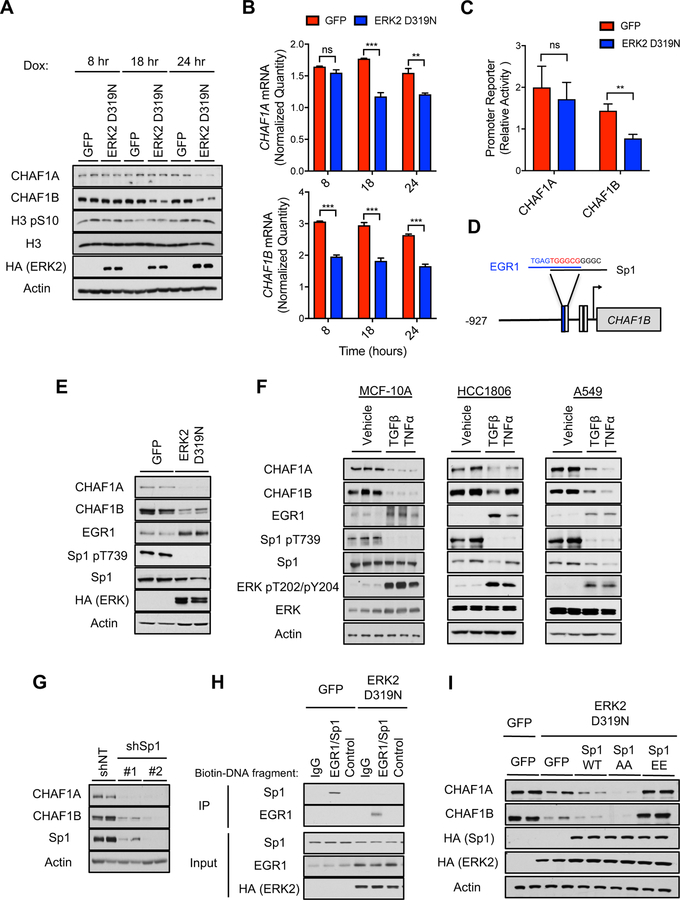
Figure 5. Metastatic signaling controls the CAF-1 complex through an ERK-mediated regulation of the CHAF1B promoter.
(A and B) Time-course analysis of CAF-1 complex and the cell cycle marker H3 pS10 protein levels (A), and CHAF1A and CHAF1B mRNA levels evaluated by qPCR (B) in MCF-10A expressing inducible ERK2 D319N for up to 24 hours; representative images (n = 4).
(C) CHAF1A and CHAF1B promoter activity measured via a luciferase reporter assay in MCF-10A expressing inducible ERK2 D319N for 3 days; luciferase values are normalized to GFP control cells (n = 6).
(D) Schematic of Sp1 and EGR1 binding sites in CHAF1B promoter.
(E) CAF-1 complex, EGR1 and Sp1 p-T739 protein levels in MCF-10A expressing inducible ERK2 D319N for 3 days; representative images (n = 4).
(F) CAF-1 complex, EGR1, Sp1 p-T739 and ERK2 p-T202/Y204 protein levels in cells treated with TGFβ + TNFα (MCF-10A for 5 days, HCC1806 and A549 for 10 days); representative images (n = 4).
(G) CHAF1A and CHAF1B protein levels in MCF-10A with shRNA-mediated Sp1 knockdown for 3 days; representative images (n = 4).
(H) Binding of Sp1 and/or EGR1 to biotinylated DNA fragments of either the CHAF1B promoter containing the overlapping Sp1/EGR1 site or a scrambled control in lysates from MCF-10A expressing inducible ERK2 D319N for 3 days; IgG control for immunoprecipitation of the DNA fragments with streptavidin; representative images (n = 4).
(I) CAF-1 complex protein levels in MCF-10A expressing inducible ERK2 D319N and either Sp1 WT or the Sp1 T453/T739 phosphorylation site mutants for 3 days; representative images (n = 4).
All values are expressed as mean ± SEM (**p < 0.01, ***p < 0.001).
See also Figure S5.

