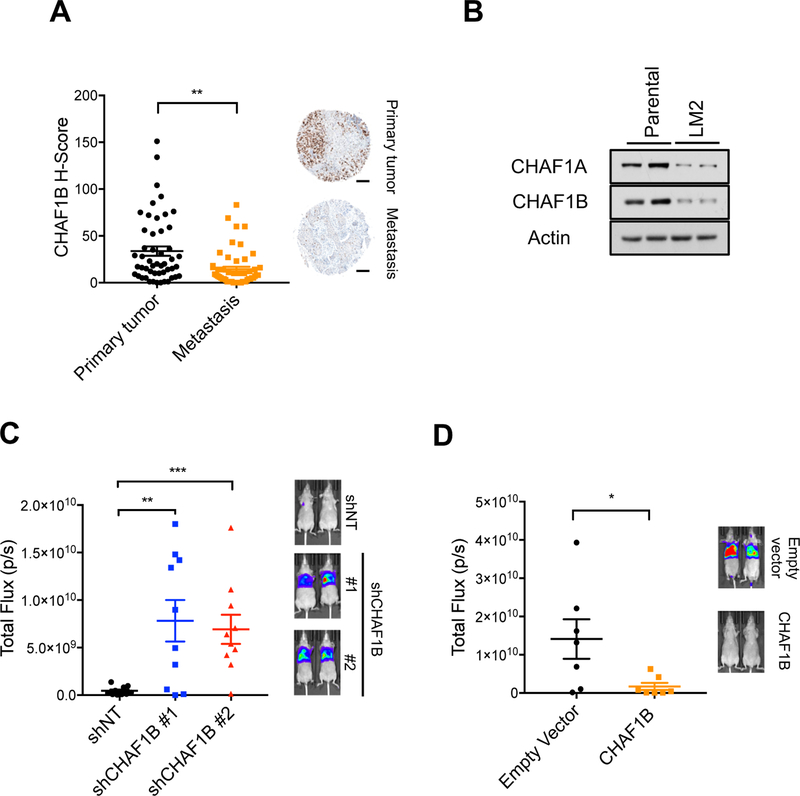
Figure 6. CAF-1 levels regulate metastatic colonization.
(A) CHAF1B levels in a tissue array of primary cancers and matched lymph node metastases from breast cancer patients (left); representative images (right) (n = 50), scale bar = 200 µm.
(B) CAF-1 complex protein levels in MDA-MB-231 parental versus the more metastatic LM2 clone; representative images (n = 4).
(C) Quantification of lung metastatic lesions of parental and CHAF1B knockdown MDA-MB-231 cells (left) (p/s indicates photons/second); representative images (right) (n = 10).
(D) Quantification of lung metastatic lesions of LM2 cells with or without CHAF1B overexpression (left) (p/s indicates photons/second); representative images (right) (n = 7).
All values are expressed as mean ± SEM (ns: not significant, *p < 0.05, **p < 0.01, ***p < 0.001).

