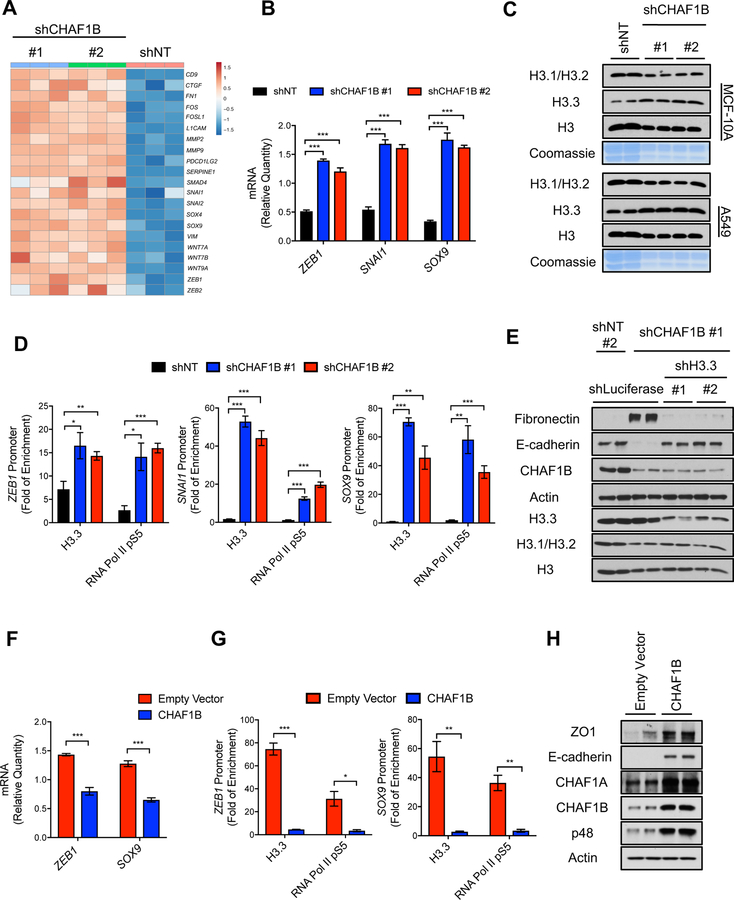
Figure 7. Suppression of the CAF-1 complex triggers an H3.3-dependent global transcriptional reprogramming that underlies the acquisition of aggressive properties.
(A) Heatmap representation of wound-healing-related and poor-prognosis genes detected in RNA-seq analysis in MCF-10A with CHAF1B knockdown for 3 days, up regulated genes are indicated with red and down regulated genes are indicated with blue, (n = 3).
(B) Relative mRNA levels of ZEB1, SNAI1 and SOX9 evaluated by qPCR in MCF-10A with CHAF1B knockdown for 3 days (n = 3).
(C) Levels of H3 histone variants in chromatin extracts and Coomassie Blue stain of total histones in histone extracts of MCF-10A and A549 both with CHAF1B knockdown for 3 days; representative images (n = 4).
(D) H3.3 and RNA Pol II pS5 enrichment at the ZEB1, SNAI1 and SOX9 promoters in MCF-10A with CHAF1B knockdown for 3 days; fold enrichment was determined using IgG as a control for the ChIP (n = 4).
(E) EMT induction determined by the protein levels of the mesenchymal marker fibronectin and the epithelial marker E-cadherin in MCF-10A cells with H3.3 suppression after CHAF1B knockdown for 10 days; representative images; histone levels are detected in whole cell lysate to show knockdown efficiency of H3.3 (n = 4).
(F) mRNA levels of ZEB1 and SOX9 evaluated by qPCR in LM2 cells overexpressing CHAF1B for 3 days (n = 4).
(G) H3.3 and RNA Pol II pS5 enrichment at the ZEB1 and SOX9 promoters in LM2 cells overexpressing CHAF1B for 10 days; fold enrichment was determined using IgG as a control for the chromatin immunoprecipitation (n = 4).
(H) Levels of epithelial markers E-cadherin and zona occludens 1 (ZO1) in LM2 cells overexpressing CHAF1B for 10 days; representative images (n = 4).
All values are expressed as mean ± SEM (*p < 0.05, **p < 0.01, ***p < 0.001).

