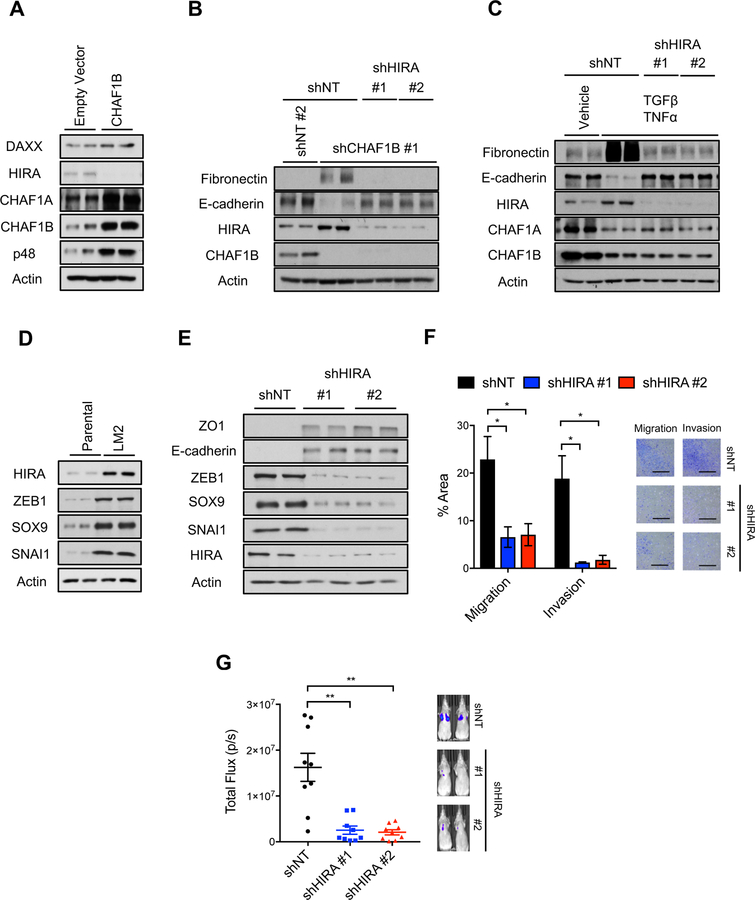
Figure 8. HIRA mediates the pro-metastatic effects of CAF-1 and is necessary for EMT induction and metastatic colonization.
(A) Levels of H3.3 chaperones in LM2 cells overexpressing CHAF1B for 10 days; representative images (n = 4).
(B) EMT induction determined by the protein levels of the mesenchymal marker fibronectin and the epithelial marker E-cadherin after 10 days of CHAF1B and HIRA knockdown in MCF-10A cells; representative images (n = 4).
(C) EMT induction determined by protein levels of the mesenchymal marker fibronectin and the epithelial marker E-cadherin after 5 days of treatment with TGFβ + TNFα in MCF-10A cells with HIRA knockdown; representative images (n = 4).
(D) Protein levels of HIRA and the EMT-inducing transcription factors ZEB1, SOX9 and SNAI1 in MDA-MB-231 parental versus the more metastatic LM2 clone; representative images (n = 4).
(E) Levels of epithelial markers E-cadherin and zona occludens 1 (ZO1) and EMT-inducing transcription factors ZEB1, SOX9 and SNAI1 in LM2 cells with HIRA knockdown for 10 days; representative images (n = 4).
(F) Quantification of migration and invasion of LM2 cells with HIRA knockdown for 10 days evaluated by transwell assays (left); representative images (right) (n = 3), scale bar = 1 mm.
(G) Quantification of lung metastatic lesions of LM2 cells with HIRA knockdown for 10 days (left); represented images (right) (n = 9).
All values are expressed as mean ± SEM (*p < 0.05, **p < 0.01, ***p < 0.001). See also Figure S8.

