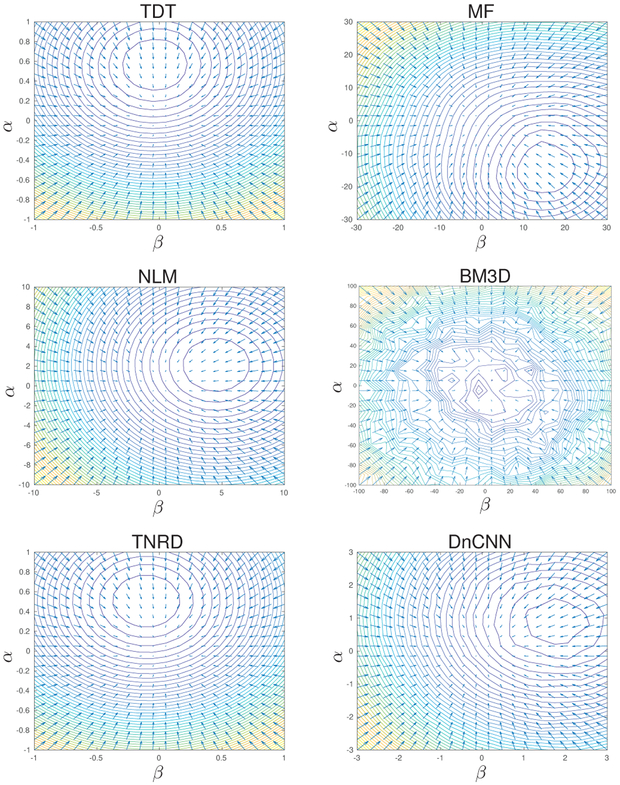
Fig. 2.
Contours show RED cost Cred(xα, β) from (14) and arrows show RED-algorithm gradient field g(xα, β) from (46) versus (α, β), where with randomly chosen e1 and e2. The subplots show that the minimizer of Cred(xα, β) is not the fixed-point , and that Cred(·) may be non-smooth and/or non-convex.

