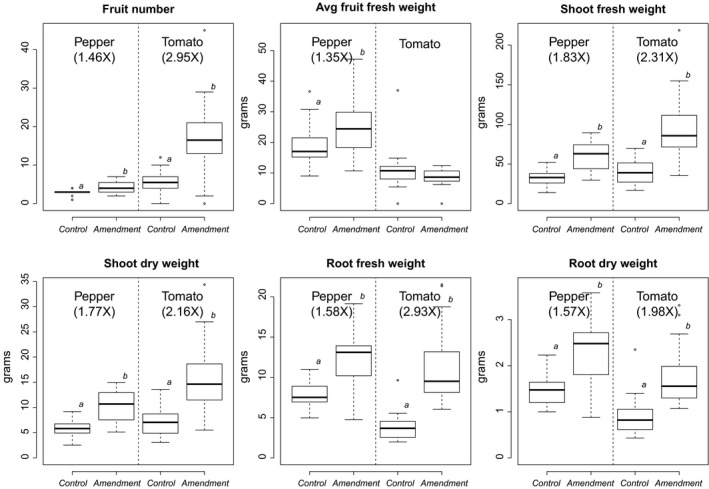
Figure 1.

Measures of plant productivity. a and b subscripts above box plots denote significant differences (P‐value < 0.005) according to the amendment effect (tomato: hen manure + ANE; pepper: ANE). Fold changes between the mean of the control and amended plants were also noted for significant differences (for pepper and tomato separately).
