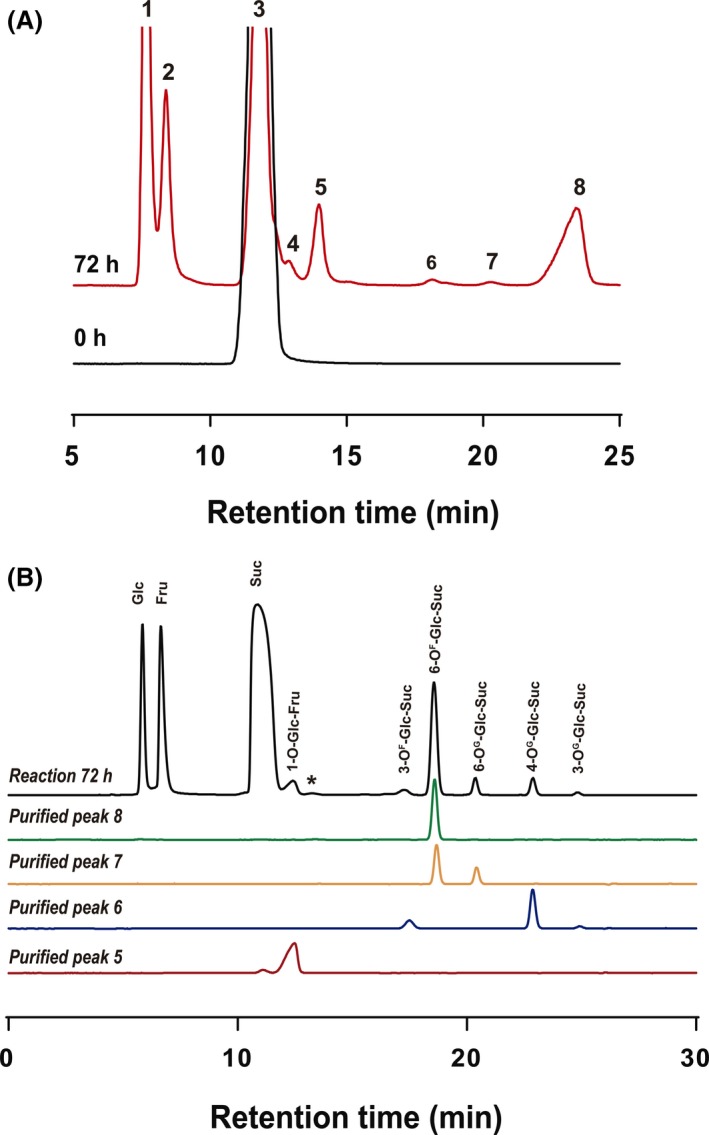
Figure 2.

Representative HPLC chromatograms of the reaction mediated by the M. reukaufii extract on sucrose 500 g l−1. A. HPLC‐ELSD analysis. Chromatograms correspond to the sugar mixtures at 0 (black line) and 72 h (red line) of reaction. Similar product profiles were obtained by using longer reaction times. Peaks assignation: (1) fructose, (2) glucose, (3) sucrose, (4–8) new signals, initially unknown compounds. B. HPAEC‐PAD analysis of carbohydrate fractions purified by semi‐preparative HPLC. Chromatographic profiles of the 72 h reaction mixture (black line) and the referenced purified peaks (red, blue, yellow and green lines) are shown. Peaks assignation using the corresponding standards: Glc: glucose; Fru: fructose; Suc: sucrose. New products assignation after MS‐ESI and NMR analysis of the purified peaks are indicated: ( * ) unknown compound.
