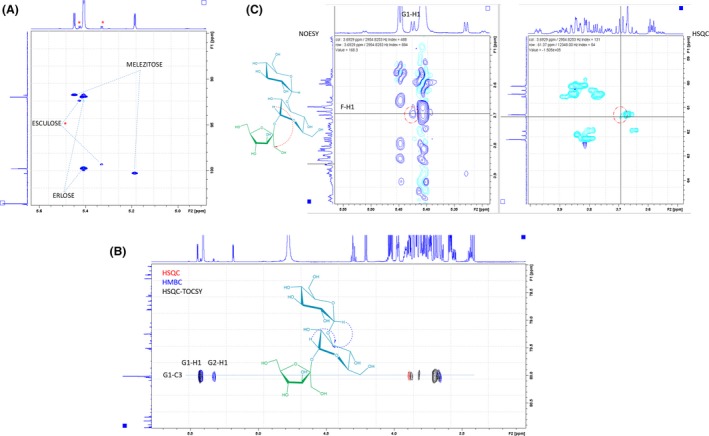
Figure 4.

NMR spectra (600 MHz, D2O, 300 K) for the minor component from the purified peak 6. A. Key region of the HSQC experiment. The minor product signals are marked with a red dot and show the existence of [α‐Glc‐(1→2)‐β‐Fru] and [α‐Glc‐(1→x)‐Fru/Glc] type residues for G1 and G2. B. Superimposition of partial HSQC (red), HMBC (blue) and HSQC‐TOCSY (black) spectra, for the 13C region of 80 ppm, demonstrating the G2‐G1 connectivity in a non‐ambiguous manner. C. The key NOE that evidences the spatial proximity of the G1‐H1/F‐H1 pair.
