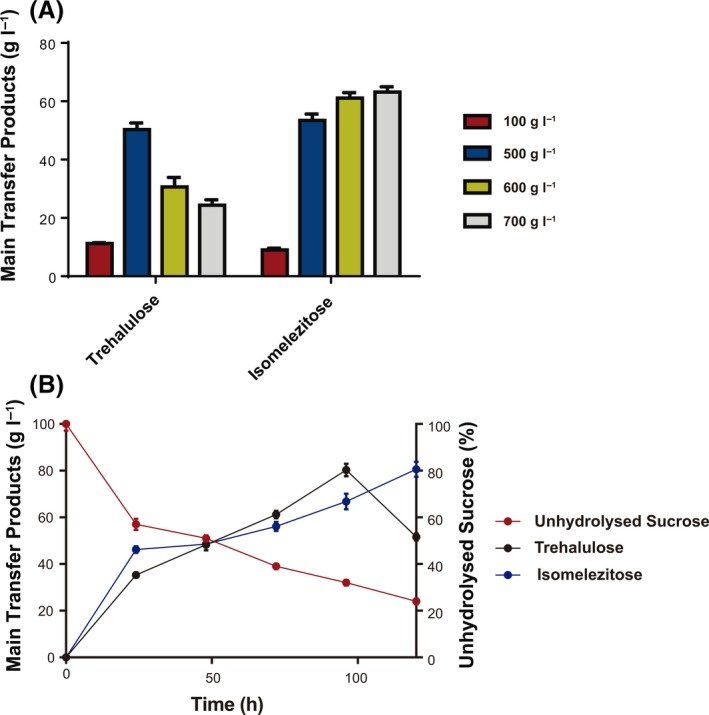
Figure 6.

Analysis of the main transglucosylation products synthesized by the M. reukaufii enzymatic extract. A. Trehalulose and isomelezitose concentrations measured by HPLC‐ELSD after 72 h of reaction using the referred initial sucrose amounts. Standard deviation values are shown. B. Time‐course reaction profile of the main transfer products using 500 g l−1 sucrose. The evolution of unhydroylsed sucrose (red line), trehalulose (black line) and isomelezitose (blue line) are shown at the indicated reaction times with the corresponding standard deviations.
