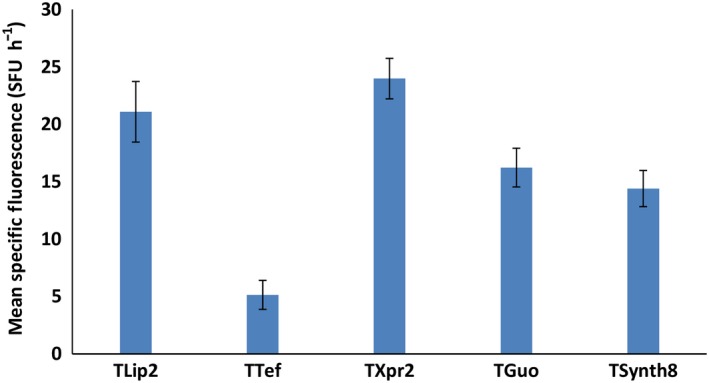
Figure 3.

Impact of different terminators on gene expression levels using RedStarII as a reporter gene under the pTEF promoter. The bars correspond to mean specific red fluorescence (position 1). The values correspond to the mean of five to seven independent clones that randomly integrated each construction. JMY1212 strain was used. Error bars represent standard deviations.
