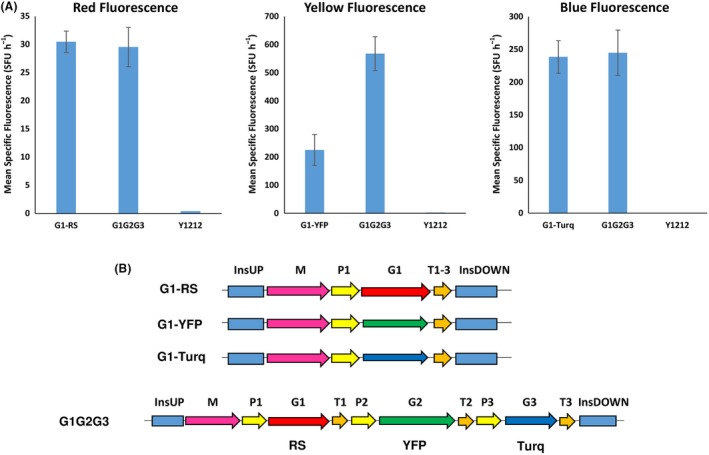
Figure 5.

A. Mean specific fluorescence of strains expressing a single fluorescent protein – RedStarII, YFP or mTurquoise – in position 1 of a 1‐TU GG vector or of strains expressing all three fluorescent proteins in a 3‐TU GG vector. In G1G2G3, RedStarII is in position 1, YFP is in position 2, and mTurquoise is in position 3. JMY1212 was the control strain. The values correspond to the average for 8–10 independent clones that randomly integrated each construct. Error bars represent standard deviations. B. Schematic of the construct used, all of them were transformed into JMY1212 strain.
