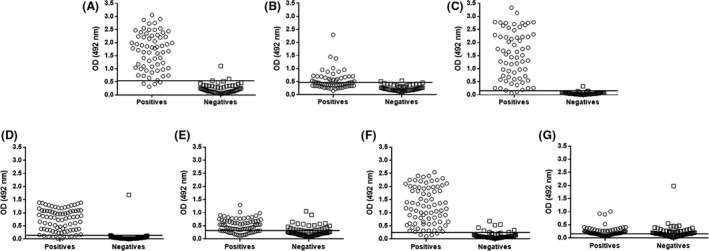
Figure 3.

Individual distribution of the OD results of the negative and positive control serum samples. For positive and negative control samples taken from goats, we used the recombinant proteins (A) PLD, (B) CP40 and (C) PLD and CP40 in a 1:1 combination. For negative and positive control samples from sheep, we used the recombinant proteins (D) PLD, (E) CP40, (F) PLD and CP40 in a 1:1 combination, and (G) PknG. The graphs indicate the OD values obtained for each positive or negative sample using each recombinant protein. The lines within the graphs represent the cut‐off value for each assay.
