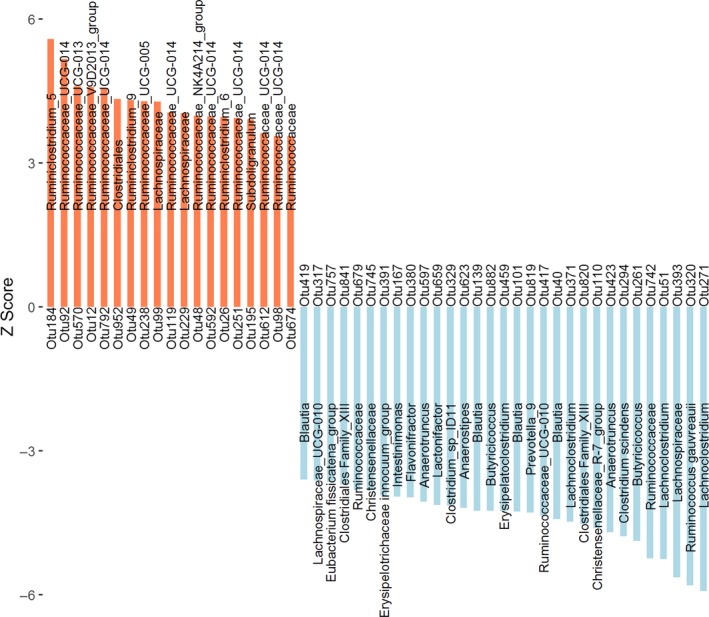
Figure 3.

The 50 OTUs showing significant associations with weaning weight (FDR adjusted P < 0.05) are shown as Z scores. The coral bar represents for positive association, the blue bar corresponds to negative association and the text on the bar shows the microbial taxa annotated to the OUT.
