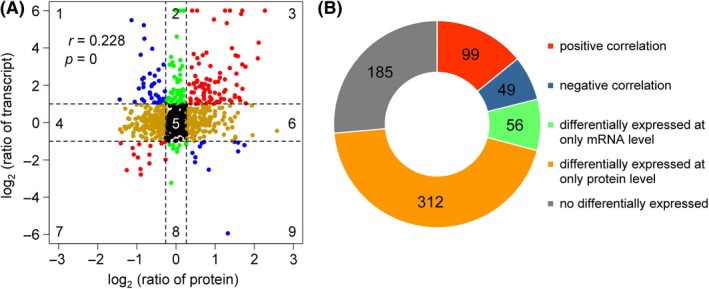
Figure 3.

Correlation between the protein and transcript levels of the genes of P. citricarpa.
A. Genes in quadrants 3 and 7 exhibited the same expression patterns on the transcript and protein levels, whereas those in quadrants 1 and 9 had different expression patterns on the transcript and protein levels. Genes in the other quadrants showed no difference in expression patterns on at least one level. r, Pearson's correlation coefficient; P, P‐value.
B. Number of genes with positive (red), negative (blue) or no correlation on the transcript and protein levels.
